FIGURE 5.

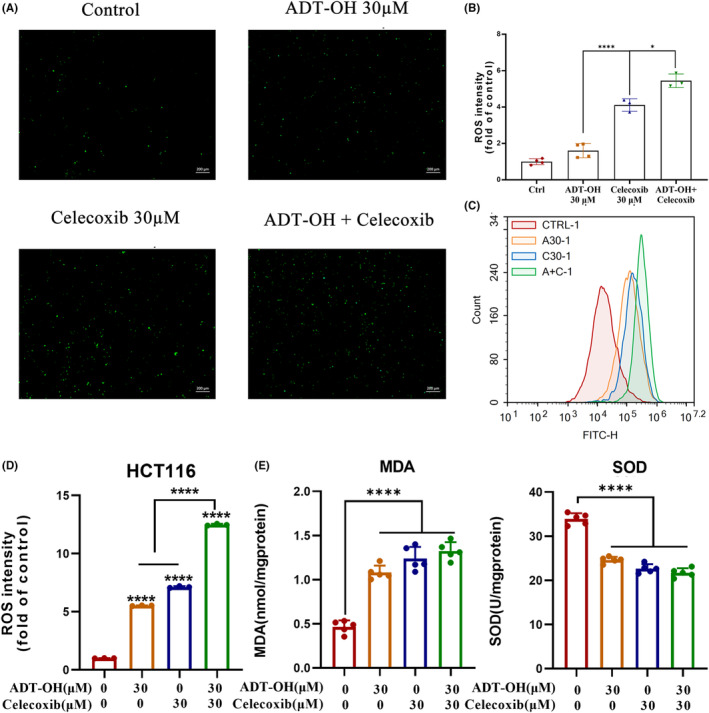
ADT‐OH combined with celecoxib promotes ROS production in HCT116 cells. (A) ROS levels in HCT116 cells were observed under the microscope after 48 h of treatment with ADT‐OH (30 μM) and/or celecoxib (30 μM). (B) Statistics of ROS levels in HCT116 cells with different drug treatments. (C) HCT116 cells were treated with ADT‐OH (30 μM) and/or celecoxib (30 μM) for 48 h, and flow cytometry was used to detect the level of ROS. (D) Statistics of ROS levels in HCT116 cells with different drug treatments. (E) MDA and SOD levels in HCT116 cells were detected according to the manufacturer's instructions after 48 h of treatment with ADT‐OH (30 μM) and/or celecoxib (30 μM). All tests were done in triplicate and performed 3 times independently. Data are presented as mean ± SD. *p < 0.05, ****p < 0.0001.
