

Abstract
Background
AT‐rich interaction domain 1A (ARID1A) is an essential subunit of the switch/sucrose non‐fermentable chromatin remodeling complex and is considered to be a tumor suppressor. The Cancer Genome Atlas (TCGA) molecular classification has deepened our understanding of gastric cancer at the molecular level. This study explored the significance of ARID1A expression in TCGA subtypes of gastric adenocarcinoma.
Methods
We collected 1248 postoperative patients with gastric adenocarcinoma, constructed tissue microarrays, performed immunohistochemistry for ARID1A, and obtained correlations between ARID1A and clinicopathological variables. We then carried out the prognostic analysis of ARID1A in TCGA subtypes. Finally, we screened patients by random sampling and propensity score matching method and performed multiplex immunofluorescence to explore the effects of ARID1A on CD4, CD8, and PD‐L1 expression in TCGA subtypes.
Results
Seven variables independently associated with ARID1A were screened out: mismatch repair proteins, PD‐L1, T stage, differentiation status, p53, E‐cadherin, and EBER. The independent prognostic variables in the genomically stable (GS) subtype were N stage, M stage, T stage, chemotherapy, size, and ARID1A. PD‐L1 expression was higher in the ARID1A negative group than in the ARID1A positive group in all TCGA subgroups. CD4 showed higher expression in the ARID1A negative group in most subtypes, while CD8 did not show the difference in most subtypes. When ARID1A was negative, PD‐L1 expression was positively correlated with CD4/CD8 expression; while when ARID1A was positive, this correlation disappeared.
Conclusions
The negative expression of ARID1A occurred more frequently in the Epstein–Barr virus and microsatellite instability subtypes and was an independent adverse prognostic factor in the GS subtype. In the TCGA subtypes, ARID1A negative expression caused increased CD4 and PD‐L1 expression, whereas CD8 expression appeared independent of ARID1A. The expression of CD4/CD8 induced by ARID1A negativity was accompanied by an increase in PD‐L1 expression.
Keywords: ARID1A, gastric adenocarcinoma, immune infiltration, prognosis, TCGA subtype
1. INTRODUCTION
According to the latest global cancer statistics report, the incidence of gastric cancer ranks fifth, and gastric cancer‐related mortality ranks fourth worldwide, seriously endangering human health. 1 Despite obvious advances in diagnostic techniques and treatments in recent years, the overall prognosis of gastric cancer remains unsatisfactory. With the development of molecular biology techniques, The Cancer Genome Atlas (TCGA) proposed the concept of molecular classification, which was classified into four subtypes in gastric cancer: Epstein–Barr virus (EBV) positive subtype, microsatellite instability (MSI) subtype, genomically stable (GS) subtype, and chromosomal instability (CIN) subtype. 2 The TCGA molecular classification not only greatly expands our knowledge on the heterogeneity and molecular complexity of gastric cancer but also shows important prognostic and therapeutic significance. Considering the high‐throughput techniques used in TCGA classification are very complex and expensive to apply on a large scale in clinical practice, several studies have proposed the immunohistochemistry (IHC) and EBV‐encoded RNA in situ hybridization (EBER‐ISH) techniques as an alternative for routine application in pathology laboratories. 3 , 4
The switch/sucrose non‐fermentable (SWI/SNF) chromatin remodeling complex dynamically alters the structure of chromatin, allowing highly condensed chromatin to expose more accessible sites for DNA binding factors, and further controlling gene expression. 5 AT‐rich interaction domain 1A (ARID1A) is a core component of the SWI/SNF complex, which plays an essential role in binding the SWI/SNF complex to DNA and is involved in regulating many critical cellular processes, such as cell proliferation, cell differentiation, and DNA repair. 6 The ARID1A protein is encoded by the eponymous ARID1A gene, which is most frequently mutated among genes encoding for the SWI/SNF complex subunits, 5 and its mutation frequency is ranked only second to that of TP53 in gastric cancer. 2 , 7 In recent years, gastric adenocarcinoma with ARID1A abnormalities has received increasing attention as a distinct tumor entity.
Currently, there are many studies on ARID1A in gastric adenocarcinoma, while the significance of ARID1A in the TCGA molecular subtypes of gastric adenocarcinoma has not been studied in depth. Herein, we explored the prognostic and immune infiltration significance of ARID1A negative expression in TCGA subtypes in 1248 patients with gastric adenocarcinoma.
2. MATERIALS AND METHODS
2.1. Patients collection and tissue microarrays construction
We collected 1347 patients with gastric adenocarcinoma who received initial surgical treatment at Weihai Municipal Hospital between January 2014 and December 2020. Subsequently, we excluded patients who received antitumor therapy before surgery (e.g., chemotherapy, radiotherapy, immunotherapy, molecular targeted therapy, etc.). The tissue microarrays (TMA) were constructed as follows. First, two pathologists carefully reviewed the hematoxylin and eosin (H&E)‐stained slides of the screened patients and marked representative tumor areas. Second, we took out one tissue core (2 mm in diameter) from each corresponding formalin‐fixed and paraffin‐embedded (FFPE) donor block using a manual tissue sampling gun (jlm‐5133, Guangdong, China) and transferred the donor tissue cores to the recipient paraffin block (ZSGB‐BIO, 60 holes, 2 mm in diameter). Finally, we fused the donor cores and the recipient block into TMAs by heating slowly to 65°C. After excluding the spots that did not contain tumor tissue and those that detached from the TMA slides, 1248 patients were included in the study.
We obtained the following clinical pathological information by reviewing the electronic medical record (EMR) systems and pathological records: age, sex, tumor site, tumor size, differentiation status, WHO histological classification, Lauren classification, vascular invasion (VI), perineural invasion (PNI), invasion depth, lymph node metastasis, and distant organ metastasis. We restaged the enrolled patients according to the latest AJCC TNM staging system (8th edition, 2019). Overall survival (OS) times was defined as the time from the date of diagnosis to the date of death or last follow‐up, which were obtained by EMR system or telephone follow‐up.
This study was approved by the Ethics Review Board of Weihai Municipal Hospital (permission code: 2021053), which considered that the written informed consent from patients was unnecessary due to this study was retrospective and was conducted anonymously. The design and workflow of this study are shown in Figure 1.
FIGURE 1.
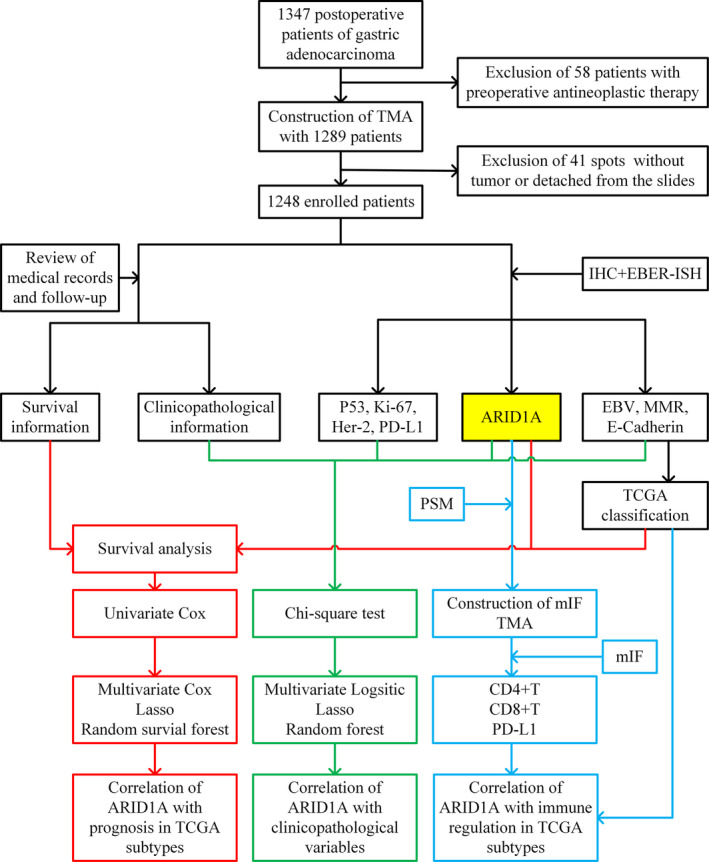
Study design and workflow of the present study. EBER‐ISH, EBV‐encoded RNA in situ hybridization; EBV, Epstein–Barr virus; Her‐2, human epidermal growth factor receptor 2; IHC, immunohistochemistry; mIF, multiplex immunofluorescence; MMR, mismatch repair; PD‐L1, programmed cell death ligand‐1; PSM, propensity score matching; TCGA, The Cancer Genome Atlas; TMA, tissue microarrays.
2.2. Immunohistochemistry and in situ hybridization
We obtained sections of 2 μm thickness from TMA blocks and then implemented IHC staining for ARID1A, E‐cadherin, p53, PD‐L1, Ki‐67, HER‐2, MSH2, MSH6, MLH1, and PSM2 using an automated immunostaining machine (Benchmark ULTRA, Ventana) following the manufacturer's procedure. The primary antibodies' information were as follows, ARID1A (EPR13501, Rabbit, 1:1000, Abcam), E‐cadherin (EP6, Rabbit, Prediluted, Origene), MSH2 (RED2, Rabbit, Prediluted, Origene), MSH6 (EP49, Rabbit, Prediluted, Origene), MLH1 (ES05, Rabbit, Prediluted, Origene), PMS2 (EP51, Rabbit, Prediluted, Origene), p53 (DO‐7, Mouse, Prediluted, Origene), PD‐L1 (SP263, Rabbit, Prediluted, Roche), Ki‐67 (MyM1‐Ki67, Mouse, Prediluted, Anbiping), and Her‐2 (4B5, Rabbit, Prediluted, Roche). If the immunohistochemical staining of Her‐2 is 2+, further fluorescence in situ hybridization (FISH) is required. We detected EBV infection by the EBER‐ISH method using the EBER assay kits (ZSGB‐BIO, ISH‐7001).
2.3. Assessment criteria for immunohistochemical staining
ARID1A was scored according to staining intensity and staining proportion of tumor cells, respectively. Staining intensity was scored as 0 (absence of any nuclear staining), 1 (faint nuclear staining), and 2 (intense nuclear staining); Staining proportion was scored as 0 (0%), 1 (1%–10%), and 2 (11%–100%). The above two scores were multiplied to obtain a final score, ranging from 0 to 4; 0 or 1 was defined as ARID1A negative, and ≥2 was defined as ARID1A positive. 8 For heterogeneous expression, the score of each component was multiplied by the proportion and then summed to obtain the final score. MMR proteins (including MLH1, PMS2, MSH2, and MSH6) were classified as present (definite nuclear staining) and lost (complete absence of nuclear staining). Any MMR proteins lost were defined as MMR deficient (dMMR), and all MMR proteins present were defined as MMR proficient (pMMR). Complete absence or apparent reduction (>30%) of membranous staining for E‐cadherin was evaluated as absent, irrespective of cytoplasmic staining. 3 The evaluation criteria for p53 were as follows: nuclear staining of inhomogeneous variable intensity was defined as wild‐type, and either complete absence of nuclear staining in all tumor cells or strong diffuse nuclear staining in more than 90% of tumor cells was defined as mutant‐type. 9 The criteria for IHC evaluation of HER2, Ki‐67, and PD‐L1 are listed in Table S1.
2.4. TCGA molecular classification
We performed an analogous TCGA molecular classification according to the staining results of EBER, MMR, and E‐cadherin. First, we selected EBER‐positive cases as EBV subtype; Next, we classified the dMMR cases into MSI subtype based on the MMR result; Then, we classified cases with E‐cadherin negative expression as GS subtype; Finally, the remaining cases were classified as CIN subtype. 3 , 4
2.5. Multiplex immunofluorescence (mIF)
We randomly screened half of the ARID1A negative patients, followed by screening ARID1A positive patients using the propensity score matching (PSM) method in a 1:1 ratio. We then marked interest regions in tumor center (TC) and invasive margin (IM) on representative H&E‐stained slides. Finally, we constructed TMAs using the same method described above for subsequent mIF analysis.
The mIF for CD4, CD8, PD‐L1, CK‐pan, and DAPI was performed at Tissuegnostics Asia Pacific Limited (Beijing, China) using a five‐color kit from Tissuegnostics (commercial number: TGFP550) following the manufacturer's protocol. Immunofluorescence images were acquired using the Tissue FAXS Cytometry platform of Tissuegnostics and were then high‐throughput quantitatively analyzed with Strata Quest software (version 7.0.1). The brief protocol was as follows: First, the fluorescence was detected by fluorescence microscope at different wavelengths in five channels respectively, dark blue for DAPI (TG470SN), skyblue for CK pan (TG430N), green for CD4 (TG520N), yellow for CD8 (TG570N), and red for PD‐L1 (TG650N). Next, the DAPI fluorescence staining channel was used for nucleus identification, and the parameters were adjusted by the “forward‐reverse tracking tools” according to the results of quantitative analysis to obtain the cell number in sight (n/sight). Then, the image segmentation of the nucleus and cytoplasm was performed, and optimal thresholds for the positivity of each marker were determined based on fluorescence signal intensity. Finally, each marker's positive cells (n/sight) were calculated according to the fluorescence signal around the nucleus.
2.6. Statistical analysis
All statistical analyses and statistical graphics were performed with R software (version 4.1.2). The chi‐square test was used to analyze the correlation between categorical variables, including the correlation between ARID1A and clinicopathological features, as well as the correlation between ARID1A and TCGA molecular classification. Variables with p < 0.05 were then screened out for the subsequent multivariate logistic regression analysis (screening variables with the stepwise method) and least absolute shrinkage and selection operator (LASSO) regression analysis, respectively. Then, a random forest model was used to sort the variables filtered out by logistic regression and LASSO according to the importance, measured by increase in node purity (IncNodePurity), with higher values indicating more significant importance. 10 The Kaplan–Meier method was used for survival analysis and plotting of survival curves, comparing the differences in survival curves by the log‐rank test. The univariate Cox regression analysis was performed to preliminary screen variables associated with prognosis. Variables with p < 0.05 were then screened out for the subsequent multivariate Cox regression analysis and LASSO regression analysis, respectively. Then, a random survival forest model was used to sort the variables according to the variable importance (VIPM), with higher values indicating stronger predictive ability. 11 The PSM method (method = “nearest”, caliper = 0.02) was used to screen ARID1A positive patients in a 1:1 ratio based on baseline characteristics of ARID1A negative patients for subsequent mIF. The independent Student's t‐test (data meet normal distribution and variance homogeneity) or Wilcoxon rank‐sum test was used to perform statistical analysis for continuous data in two groups. Spearman's rank test was used to analyze the correlation between immune markers (CD4, CD8, and PD‐L1). Two‐sided tests were adopted, and the differences were considered statistically significant when p < 0.05.
The R packages used in this study were listed as follows: ggplot2 (3.3.6), rcompanion (2.4.18), epiDisplay (3.5.0.1), MASS (7.3–54), forestmodel (0.6.2), glmnet (4.1–3), randomForest (4.7–1.1), survival (3.2–13), survminer (0.4.9), randomForestSRC (3.1.1), pheatmap (1.0.12), and MatchIt (4.3.1).
3. RESULTS
3.1. Clinicopathological information of the patients
A total of 1248 patients were enrolled in this study with a median age of 64 years (range: 28.0–88.0), nearly 3/4 (929, 74.44%) were male, and most of the lesions were located in the antrum (759, 60.82%). The distribution of AJCC TNM stage I, II, III, and IV in the cohort was 310 (24.84%), 299 (23.96%), 576 (46.15%), and 63 (5.05%), respectively. The main IHC findings were as follows: ARID1A negative in 275 patients (22.04%), EBER positive in 71 patients (5.69%), dMMR in 184 patients (14.74%), E‐cadherin absent in 418 patients (33.49%), Her‐2 positive in 79 patients (6.33%), and PD‐L1 positive in 87 patients (6.97%). The detailed clinicopathological information is shown in the “Total” column of Table 1. Typical IHC and EBER images are shown in Figure 2.
TABLE 1.
Univariate correlation analysis of ARID1A with clinicopathological variables.
| ARID1A | ||||
|---|---|---|---|---|
| Variables | Total | Negative | Positive | p‐Value |
| Age | ||||
| 1248 | 275 (22.04) | 973 (77.96) | 0.458 | |
| <60 | 372 (29.81) | 77 (28) | 295 (30.32) | |
| ≥60 | 876 (70.19) | 198 (72) | 678 (69.68) | |
| Sex | 0.094 | |||
| Female | 319 (25.56) | 81 (29.45) | 238 (24.46) | |
| Male | 929 (74.44) | 194 (70.55) | 735 (75.54) | |
| Site | 0.141 | |||
| Antrum | 759 (60.82) | 156 (56.73) | 603 (61.97) | |
| Body | 357 (28.61) | 82 (29.82) | 275 (28.26) | |
| Cardia | 132 (10.58) | 37 (13.45) | 95 (9.76) | |
| Size | 0.003 | |||
| <4 cm | 624 (50) | 116 (42.18) | 508 (52.21) | |
| ≥4 cm | 624 (50) | 159 (57.82) | 465 (47.79) | |
| T‐stage | <0.001 | |||
| T1 | 227 (18.19) | 23 (8.36) | 204 (20.97) | |
| T2 | 185 (14.82) | 47 (17.09) | 138 (14.18) | |
| T3 | 204 (16.35) | 41 (14.91) | 163 (16.75) | |
| T4 | 632 (50.64) | 164 (59.64) | 468 (48.1) | |
| N‐stage | 0.094 | |||
| N0 | 484 (38.78) | 101 (36.73) | 383 (39.36) | |
| N1 | 210 (16.83) | 53 (19.27) | 157 (16.14) | |
| N2 | 218 (17.47) | 58 (21.09) | 160 (16.44) | |
| N3 | 336 (26.92) | 63 (22.91) | 273 (28.06) | |
| M‐stage | 0.026 | |||
| M0 | 1185 (94.95) | 254 (92.36) | 931 (95.68) | |
| M1 | 63 (5.05) | 21 (7.64) | 42 (4.32) | |
| TNM‐stage | 0.006 | |||
| I | 310 (24.84) | 51 (18.55) | 259 (26.62) | |
| II | 299 (23.96) | 76 (27.64) | 223 (22.92) | |
| III | 576 (46.15) | 127 (46.18) | 449 (46.15) | |
| IV | 63 (5.05) | 21 (7.64) | 42 (4.32) | |
| Differentiation | <0.001 | |||
| Moderate | 142 (11.38) | 27 (9.82) | 115 (11.82) | |
| Poor | 699 (56.01) | 189 (68.73) | 510 (52.42) | |
| Well | 407 (32.61) | 59 (21.45) | 348 (35.77) | |
| WHO | 0.659 | |||
| Tubular | 642 (51.44) | 141 (51.27) | 501 (51.49) | |
| Papillary | 49 (3.93) | 9 (3.27) | 40 (4.11) | |
| Poorly cohesive | 498 (39.9) | 115 (41.82) | 383 (39.36) | |
| Mucinous | 59 (4.73) | 10 (3.64) | 49 (5.04) | |
| Lauren | <0.001 | |||
| Diffuse | 666 (53.37) | 170 (61.82) | 496 (50.98) | |
| Intestinal | 418 (33.49) | 66 (24) | 352 (36.18) | |
| Mixed | 164 (13.14) | 39 (14.18) | 125 (12.85) | |
| VI | 0.004 | |||
| No | 650 (52.08) | 122 (44.36) | 528 (54.27) | |
| Yes | 598 (47.92) | 153 (55.64) | 445 (45.73) | |
| PNI | 0.861 | |||
| No | 907 (72.68) | 201 (73.09) | 706 (72.56) | |
| Yes | 341 (27.32) | 74 (26.91) | 267 (27.44) | |
| Her‐2 | 0.018 | |||
| Negative | 1169 (93.67) | 266 (96.73) | 903 (92.81) | |
| Positive | 79 (6.33) | 9 (3.27) | 70 (7.19) | |
| Ki‐67 | 0.214 | |||
| High | 1021 (81.81) | 232 (84.36) | 789 (81.09) | |
| Low | 227 (18.19) | 43 (15.64) | 184 (18.91) | |
| PD‐L1 | <0.001 | |||
| Negative | 1161 (93.03) | 227 (82.55) | 934 (95.99) | |
| Positive | 87 (6.97) | 48 (17.45) | 39 (4.01) | |
| EBER | <0.001 | |||
| Negative | 1177 (94.31) | 248 (90.18) | 929 (95.48) | |
| Positive | 71 (5.69) | 27 (9.82) | 44 (4.52) | |
| MMR | <0.001 | |||
| dMMR | 184 (14.74) | 95 (34.55) | 89 (9.15) | |
| pMMR | 1064 (85.26) | 180 (65.45) | 884 (90.85) | |
| p53 | <0.001 | |||
| Mutation | 527 (42.23) | 71 (25.82) | 456 (46.87) | |
| Wild | 721 (57.77) | 204 (74.18) | 517 (53.13) | |
| E‐cadherin | <0.001 | |||
| Negative | 418 (33.49) | 128 (46.55) | 290 (29.8) | |
| Positive | 830 (66.51) | 147 (53.45) | 683 (70.2) | |
Variables with p < 0.05 were shown in bold value.
Abbreviations: dMMR, mismatch repair deficient; EBER, EBV‐encoded RNA; Her‐2, human epidermal growth factor receptor 2; MMR, mismatch repair; PD‐L1, programmed cell death ligand‐1; pMMR, mismatch repair proficient; PNI, perineural invasion; VI, vascular invasion.
FIGURE 2.
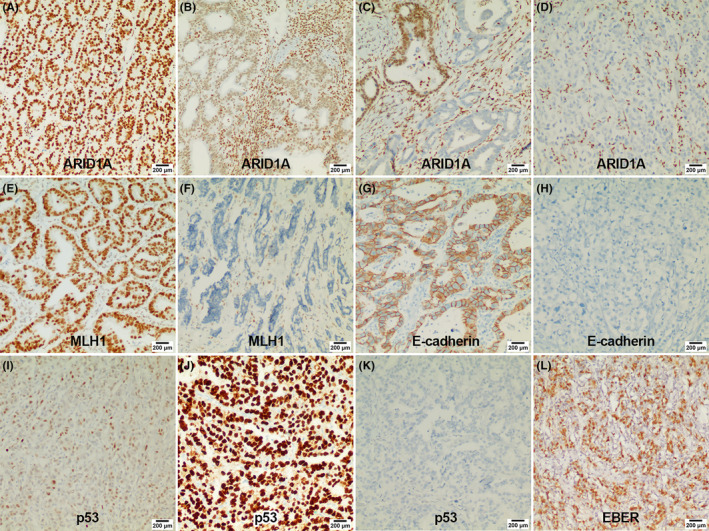
Representative immunohistochemistry images of important markers. (A) Diffuse strong expression of ARID1A; (B) reduced expression of ARID1A; (C) heterogeneous expression of ARID1A; (D) complete loss expression of ARID1A; (E) positive expression of MLH1; (F) negative expression of MLH1; (G) positive expression of E‐cadherin; (H) negative expression of E‐cadherin; (I) wild‐type expression of p53 (nuclear staining of variable intensity); (J) mutant‐type expression of p53 (diffuse and uniform strong nuclear staining); (K) mutant‐type expression of p53 (complete absence of nuclear staining); (L) positive expression of EBV. EBER, EBV‐encoded RNA; EBER‐ISH, EBV‐encoded RNA in situ hybridization.
The distribution of EBV, MSI, GS, and CIN subtypes in the entire cohort was 71 (5.69%), 181 (14.5%), 331 (26.52%), and 665 (53.29%), respectively (Figure 3A,B). Among the TCGA subtypes, the MSI subtype showed the highest proportion of ARID1A negative (51.38%), followed by the EBV subtype (38.03%); however, there was no statistical difference between these two subtypes (Figure 3C). The specific statistical results of pairwise comparison among subtypes are shown in Table S2.
FIGURE 3.
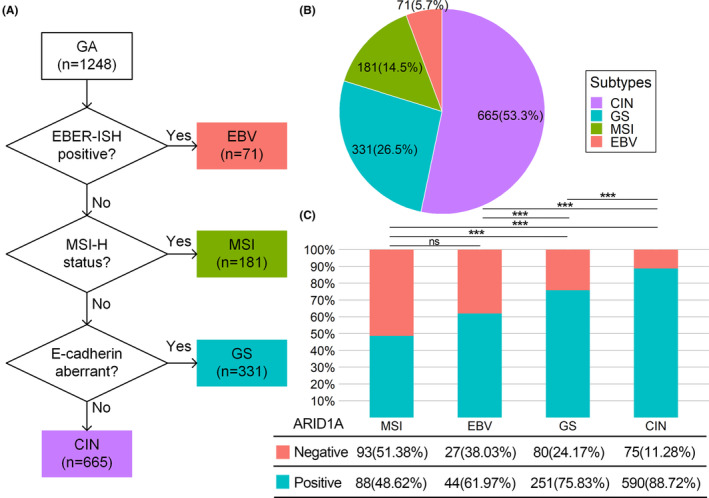
(A) Flowchart of TCGA molecular classification based on IHC and EBER‐ISH. (B) Distribution of TCGA subtypes. (C) ARID1A expression in TCGA subtypes. CIN, chromosomal instability; EBV, Epstein–Barr virus; GS, genomically stable; MSI, microsatellite instability; ns, no significance. ***: p < 0.001.
3.2. Correlation between ARID1A expression and clinicopathologic variables
Univariate correlation analysis between ARID1A expression and clinicopathological variables identified 13 variables with p < 0.05 as follows: Size, T stage, M stage, TNM stage, differentiation status, Lauren classification, VI, Her‐2, PD‐L1, EBER, MMR, p53, and E‐cadherin (Table 1).
We performed multivariate logistic regression analysis (Figure 4A) and LASSO regression analysis (Figure 4B,C) for the above 13 variables, and screened out seven independent correlated variables, which were ranked using random forest according to the importance as follows: MMR, PD‐L1, T‐stage, differentiation status, p53, E‐cadherin, and EBER (Figure 4D). Details of variables filtered out by LASSO regression and the ranking of the variables by random forest are presented in Table S3.
FIGURE 4.
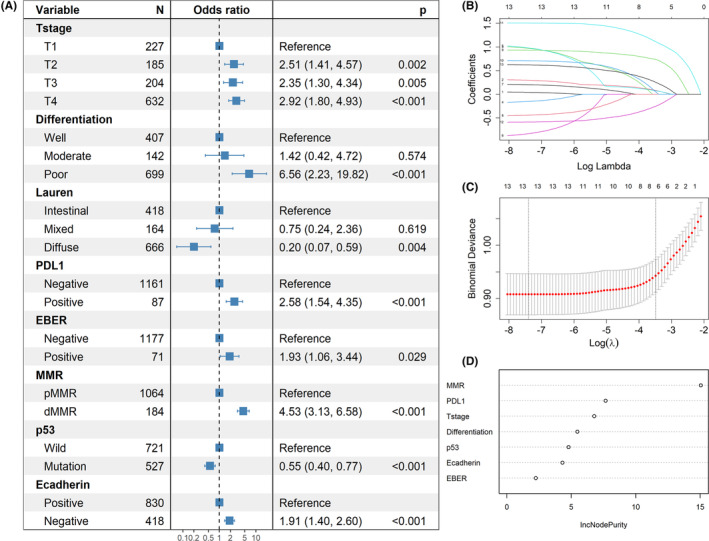
Correlation analysis of ARID1A. (A) Variables screened by multivariate logistic regression analysis. (B) and (C) Variables filtered out by the minimalist model of LASSO regression. (D) Variables ranked by importance using random forest. dMMR, mismatch repair deficient; EBER, EBV‐encoded RNA; MMR: mismatch repair; PD‐L1, programmed cell death ligand‐1; pMMR, mismatch repair proficient.
3.3. Survival and prognostic analysis
Univariate log‐rank survival analysis revealed that the ARID1A negative group showed a worse survival than the ARID1A positive group (p = 0.0001, Figure 5A). The GS subgroup exhibited a significantly worse survival than the other three subtypes (p < 0.0001, Figure 5B), and statistical results of pairwise comparisons between subgroups were shown in Table S4. We also performed survival analyses of ARID1A expression in each TCGA subtype and found that ARID1A negative group showed worse survival only in the GS subgroup (p < 0.0001, Figure 5C), whereas ARID1A negative was not associated with worse survival in the other three subtypes (Figure 5D–F).
FIGURE 5.
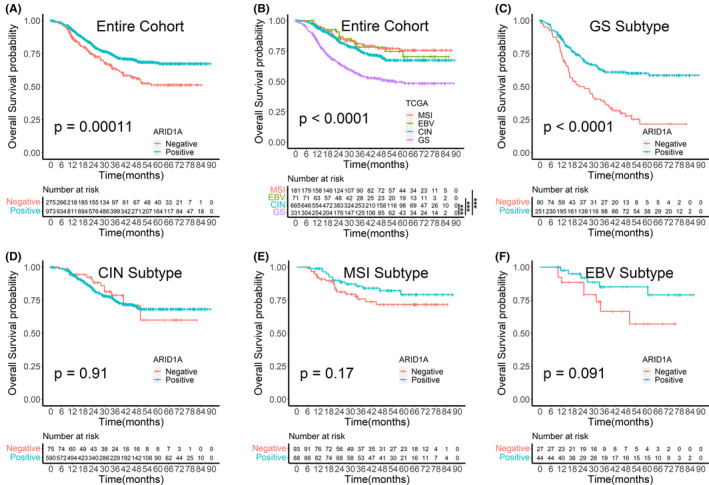
Survival analysis plots. (A) Survival analysis by ARID1A expression in the entire cohort. (B) Survival analysis by TCGA subtypes in the entire cohort. (C)–(F) Survival analysis by ARID1A expression in TCGA subtypes. CIN, chromosomal instability; EBV, Epstein–Barr virus; GS, genomically stable; MSI, microsatellite instability. ***: p < 0.001.
We carried out univariate and multivariate Cox regression analyses in the entire cohort and found that ARID1A negative expression was an adverse factor for poor prognosis in the univariate Cox regression analysis, whereas this association disappeared after the multivariate Cox regression analysis (Table S5). We subsequently performed univariate Cox regression analysis in the GS subtype and screened out 11 variables associated with prognosis: age, size, VI, PNI, ARID1A, chemotherapy, WHO histological classification, differentiation status, T stage, N stage, and M stage (Table 2). Next, we performed multivariate Cox regression analysis and LASSO regression analysis for the above 11 variables and screened out six independent prognostic variables, which were ranked using a random survival forest according to the importance as follows: N stage, M stage, T stage, chemotherapy, size, and ARID1A (Figure 6D). The information of variables filtered out by LASSO regression and the ranking of the variables by random survival forest were presented in Table S6.
TABLE 2.
Univariate and multivariate Cox regression analysis for overall survival in GS subtype.
| Variables | Univariate Cox | p‐Value | Multivariate Cox | p‐Value |
|---|---|---|---|---|
| HR (95% CI) | HR (95% CI) | |||
| Sex (ref = female) | ||||
| Male | 1.12 (0.75–1.66) | 0.579 | ||
| Age (ref = “<60”) | ||||
| ≥60 | 1.67 (1.11–2.50) | 0.013 | 1.48(0.96–2.28) | 0.076 |
| Size (ref = “<4 cm”) | ||||
| ≥4 cm | 2.52 (1.78–3.56) | <0.001 | 1.64(1.12–2.39) | 0.01 |
| Site (ref = antrum) | ||||
| Body | 1.15 (0.79–1.67) | 0.460 | ||
| Cardia | 1.45 (0.86–2.45) | 0.163 | ||
| Differentiation (ref = well) | ||||
| Moderate | 1.17 (0.60–2.27) | 0.640 | 0.91(0.45–1.86) | 0.797 |
| Poor | 1.57 (1.02–2.40) | 0.039 | 1.25(0.69–2.28) | 0.457 |
| WHO (ref = tubular) | ||||
| Papillary | 3.53 (1.71–7.26) | 0.001 | 4.17(1.88–9.24) | <0.001 |
| Poorly cohesive | 1.65 (1.14–2.38) | 0.008 | 1.61(0.97–2.69) | 0.068 |
| Mucinous | 0.87 (0.42–1.78) | 0.703 | 0.49(0.21–1.12) | 0.09 |
| Lauren (ref = intestinal) | ||||
| Mixed | 0.88 (0.47–1.67) | 0.706 | ||
| Diffuse | 1.41 (0.93–2.13) | 0.105 | ||
| T_stage (ref = T1) | ||||
| T2 | 2.62 (0.69–9.86) | 0.156 | 1.48(0.37–5.84) | 0.577 |
| T3 | 10.90 (3.21–36.93) | <0.001 | 3.22(0.85–12.18) | 0.084 |
| T4 | 12.01 (3.81–37.82) | <0.001 | 3.92(1.12–13.75) | 0.033 |
| N_stage (ref = N0) | ||||
| N1 | 2.12 (1.05–4.26) | 0.035 | 1.8(0.88–3.71) | 0.109 |
| N2 | 4.73 (2.52–8.87) | <0.001 | 2.5(1.25–5) | 0.009 |
| N3 | 6.84 (3.85–12.14) | <0.001 | 3.15(1.67–5.96) | <0.001 |
| M_stage (ref = M0) | ||||
| M1 | 5.46 (3.3–9.02) | <0.001 | 3.65(2.13–6.24) | <0.001 |
| VI (ref = no) | ||||
| Yes | 1.91 (1.35–2.71) | <0.001 | 1.13(0.76–1.66) | 0.555 |
| PNI (ref = no) | ||||
| Yes | 1.94 (1.39–2.71) | <0.001 | 0.99(0.69–1.42) | 0.9385 |
| Her‐2 (ref = negative) | ||||
| Positive | 0.86 (0.42–1.75) | 0.672 | ||
| Ki‐67 (ref = low) | ||||
| High | 0.97 (0.63–1.49) | 0.895 | ||
| PD‐L1 (ref = negative) | ||||
| Positive | 1.49 (0.73–3.03) | 0.277 | ||
| ARID1A (ref = positive) | ||||
| Negative | 2.33 (1.66–3.26) | <0.001 | 1.44(1.01–2.08) | 0.04 |
| Chemo (ref = no) | ||||
| Yes | 0.65 (0.46–0.90) | 0.010 | 0.56(0.39–0.81) | 0.002 |
Variables with p < 0.05 were shown in bold value.
Abbreviations: Chemo, chemotherapy; Her‐2, human epidermal growth factor receptor 2; PD‐L1, programmed cell death ligand‐1; PNI, perineural invasion; ref, reference; VI, vascular invasion.
FIGURE 6.
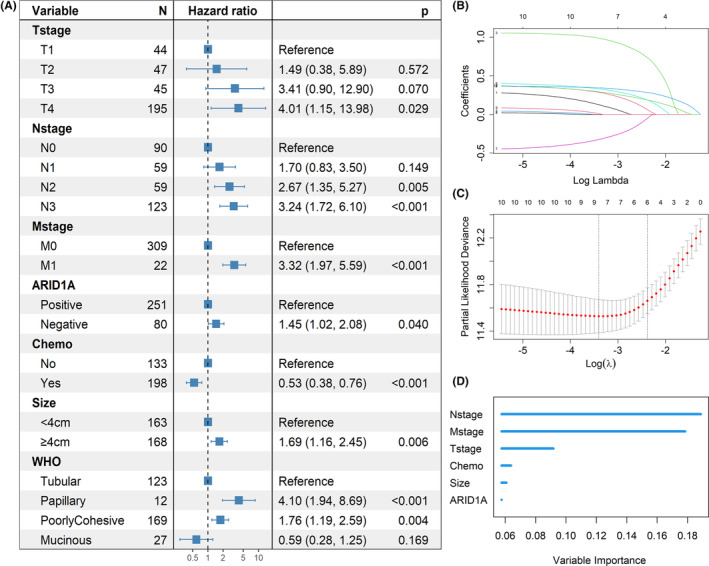
Prognostic analysis in the GS subtype. (A) Independent prognostic variables screened by univariate and multivariate Cox regression analysis. (B) and (C) Variables filtered out by the minimalist model of LASSO regression. (D) Variables ranked by importance using random survival forest. Chemo, chemotherapy.
3.4. Correlation of ARID1A with CD4 + and CD8 + T cells and PD‐L1 expression
After PSM and exclusion of spots without tumor tissue or detached from the slides, 107 ARID1A positive patients and 128 ARID1A negative patients were included in the mIF study. The distribution plot of propensity scores was shown in Figure S1, and comparisons of baseline characteristics after PSM were shown in Table S7.
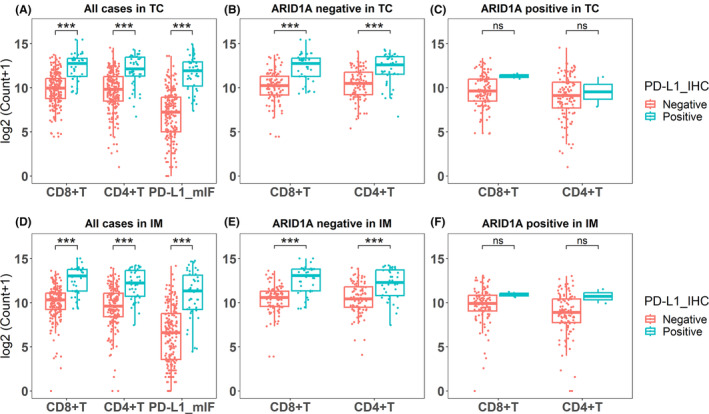
The heatmap showed that the expression of CD4, CD8, and PD‐L1 clustered into a high expression category (red predominant) and a low expression category (blue predominant); this means the ARID1A negative group had higher expression of CD4, CD8, and PD‐L1 than ARID1A positive group (Figure 7A,C). The barplots showed that the proportion of EBV and MSI subtypes was significantly higher in the ARID1A negative group than in the ARID1A positive group (Figure 7B,C). Detailed statistics results were shown in Table S8. We analyzed the correlation between ARID1A and immune infiltration after stratification according to TCGA classification. The boxplots showed that the ARID1A negative group had higher expression of CD4, CD8, and PD‐L1 than the ARID1A positive group in the entire cohort (Figure 8A,F). PD‐L1 expression was higher in the ARID1A negative group than in the ARID1A positive group in all TCGA subgroups. CD4 did not show differences in the EBV subtype of the IM (Figure 8J), while showed higher expression of the ARID1A negative group in the remaining subtypes. CD8 showed higher expression of the ARID1A negative group in the MSI subtype of the IM (Figure 8I), while did not show difference in the remaining subtypes.
FIGURE 7.
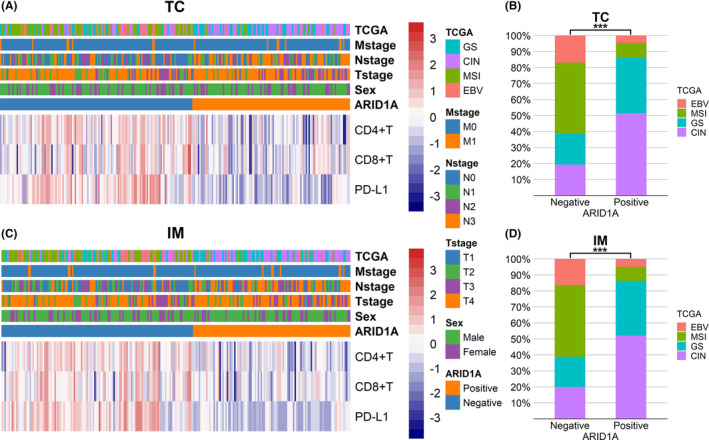
Heatmaps of CD4, CD8, and PDL1 expression and bar plots of TCGA subtypes distribution. (A) Heatmap of CD4, CD8, and PD‐L1 expression in tumor center. (B) Distribution of TCGA subtypes in ARID1A negative and positive groups in tumor center. (C) Heatmap of CD4, CD8, and PD‐L1 expression in invasive margin. (D) Distribution of TCGA subtypes in ARID1A negative and positive groups in invasive margin. CIN, chromosomal instability; EBV, Epstein–Barr virus; GS, genomically stable; IM, invasive margin; MSI, microsatellite instability; TC, tumor center; TCGA, The Cancer Genome Atlas. ***: p < 0.001.
FIGURE 8.
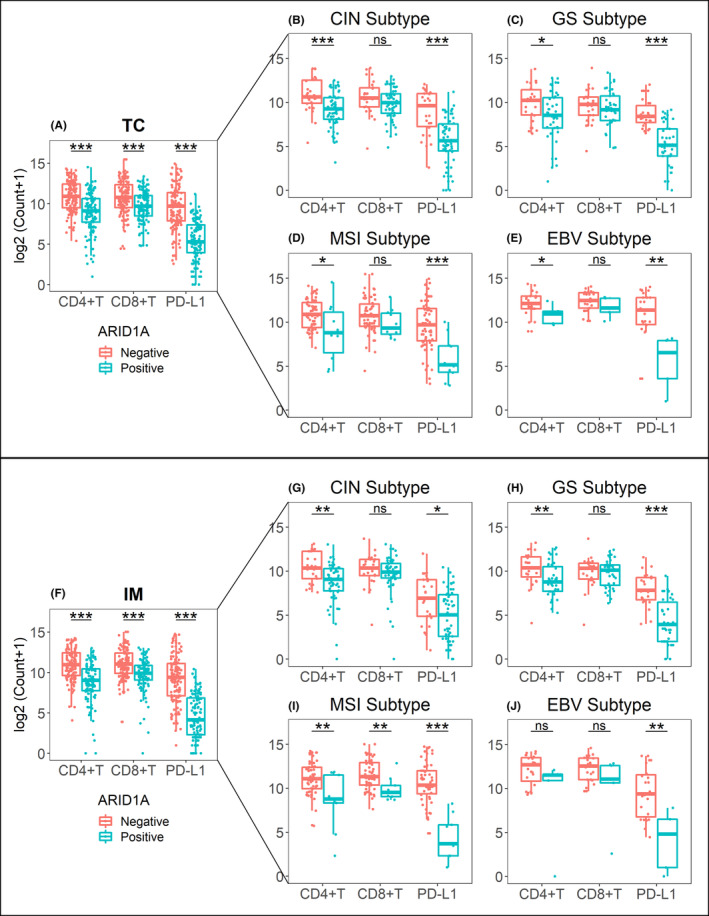
Impact of ARID1A status on the expression of CD4, CD8, and PD‐L1. (A) The entire mIF cohort in tumor center; (B)–(E) TCGA subtypes in tumor center; (F) the entire mIF cohort in invasive margin; (G)–(J) TCGA subtypes in invasive margin. CIN, chromosomal instability; EBV, Epstein–Barr virus; GS, genomically stable; IM, invasive margin; MSI, microsatellite instability; ns, no significance; TC, tumor center. *: p < 0.05; **: p < 0.01; ***: p < 0.001.
We analyzed the correlation between PD‐L1 expression in IHC and immune infiltration. The results showed that the PD‐L1 expression in IHC was consistent with that in mIF (Figure 9A,D). When ARID1A was negative, the expression of CD4/CD8 in the PD‐L1 positive group was significantly higher than that in PD‐L1 negative group (Figure 9B,E), and when ARID1A was positive, this correlation disappeared (Figure 9C,F). Further, we analyzed the linear relationship among PD‐L1, CD4, and CD8 according to the data from mIF. We found a positive correlation between these three markers in ARID1A negative gastric carcinomas (Figure 10B,E), while PD‐L1 was not associated with CD4/ CD8 in ARID1A positive cases (Figure 10C,F). Typical images of mIF were shown in Figure 11.
FIGURE 9.
The correlation between PD‐L1 expression of IHC and immune infiltration. (A) and (D) The PD‐L1 expression in IHC was consistent with that in mIF; The expression of CD4/CD8 in the PD‐L1 positive group was significantly higher than that in PD‐L1 negative group for all cases. (B) and (E) When ARID1A was negative, the expression of CD4/CD8 in the PD‐L1 positive group was significantly higher than that in PD‐L1 negative group. (C) and (F) When ARID1A was positive, there was no difference in the expression of CD4/CD8 between PD‐L1 negative and PD‐L1 positive groups. IM, invasive margin; mIF, multiplex immunofluorescence; ns, no significance; TC, tumor center. *: p < 0.05; **: p < 0.01; ***: p < 0.001.
FIGURE 10.
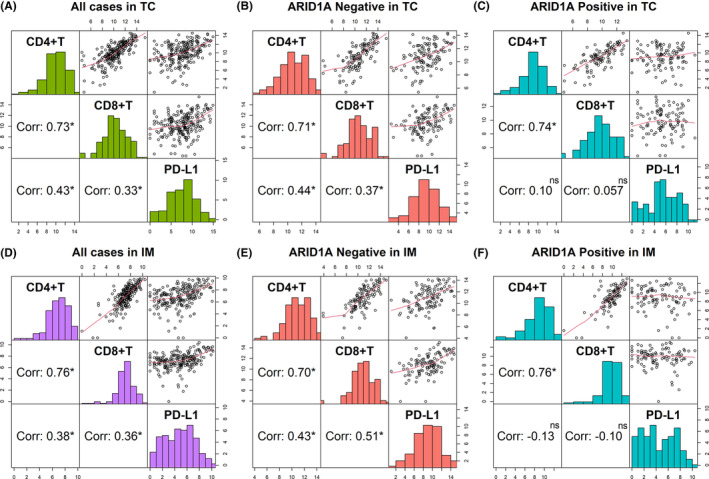
The correlation between PD‐L1 expression, CD4+, and CD8+ T cell infiltration in mIF. (A) and (D) PD‐L1, CD4, and CD8 were positively correlated in all cases; (B) and (E) PD‐L1, CD4, and CD8 were positively correlated in ARID1A negative cases; (C) and (F) CD4 and CD8 were positively correlated, while PD‐L1 was not associated with CD4 and CD8 in ARID1A positive cases. Corr, correlation coefficients; IM, invasive margin; ns, no significance; TC, tumor center; *: p < 0.05; **: p < 0.01; ***: p < 0.001.
FIGURE 11.
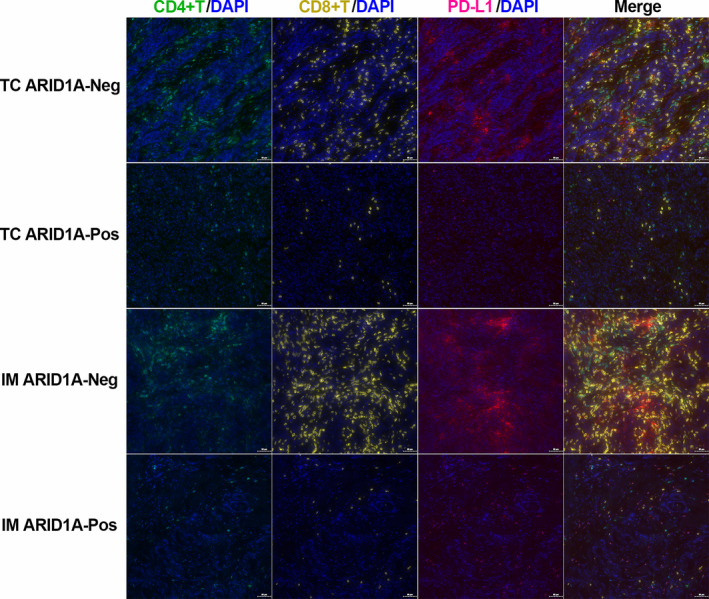
Representative mIF images according to the expression status of ARID1A in the tumor center and invasive margin. IM ARID1A‐Neg, invasive margin and ARID1A negative; IM ARID1A‐Pos, invasive margin and ARID1A positive; TC ARID1A‐Neg, tumor center and AIRD1A negative; TC ARID1A‐Pos, tumor center and AIRD1A positive.
4. DISCUSSION
ARID1A mutation has been observed in various tumors, particularly gynecological tumors, such as 57% of ovarian clear cell carcinomas 12 and 25% of endometrial carcinomas. 13 In gastric cancer, ARID1A has also been identified as a novel driver gene 14 with a mutation frequency of 14%–24%. 2 , 7 The most common types of mutations were nonsense and frameshift mutations, leading to functional abnormalities of the ARID1A protein. Thus, negative expression of the ARID1A protein may reflect the mutation status of the ARID1A gene. 14 , 15 Many studies have confirmed that ARID1A expression is associated with multiple clinicopathological features of gastric cancer. 16 , 17 In this study, we screened out seven clinicopathological variables, among which MMR, EBER, and E‐cadherin were used for TCGA classification.
In this study, we found that the proportion of ARID1A negative expression varied significantly among different TCGA molecular subtypes, with higher ARID1A negative proportion in the MSI subtype and EBV subtype, illustrating the close correlation of ARID1A with MSI and EBV, which is consistent with previous TCGA findings. 2 The coding region of the ARID1A gene contains many microsatellites. 14 A study concerning exome sequencing of MSI colorectal cancers showed that the ARID1A gene exhibited more frequent short tandem repeats (STR) mutations, inferring MMR deficiency as the underlying cause of ARID1A mutations. 18 However, a study of endometrial cancer found that ARID1A plays a role in epigenetic silencing (methylation) of the MLH1 gene, speculating that ARID1A mutations preceded MSI. 19 Another proteomic study showed that ARID1A recruited MSH2 to chromatin during DNA replication and promoted MMR, whereas ARID1A inactivation led to MMR deficiency. 20 Although the causal relationship between ARID1A and MSI is controversial, an increasing number of studies have shown that ARID1A was a causative gene for MSI rather than the target gene. A study confirmed that loss of ARID1A in EBV‐positive gastric cancer was partly regulated by EBV‐encoded miRNAs 21 ; meanwhile, ARID1A loss increased the susceptibility of gastric epithelial cells to EBV infection and promoted gastric tumorigenesis. 22 Several other variables related to ARID1A observed in this study were also confirmed in previous studies. For example, E‐cadherin expression was downregulated or absent when ARID1A was silenced, 23 and the loss of E‐cadherin led to epithelial‐mesenchymal transition (EMT), further increasing tumor aggressiveness. 24 ARID1A was inversely correlated with TP53, and simultaneous mutations in ARID1A and TP53 were rarely observed in the same tumor. 14 , 19 , 25 In addition, the loss of ARID1A caused worse differentiation and deeper tumor invasion in gastric cancer. 16 , 17
Loss of ARID1A resulted in higher T stage, worse differentiation, and E‐cadherin deficiency in this study, which are well‐known factors contributing to poor prognosis in gastric cancer. Interestingly, loss of ARID1A is closely associated with MSI and EBV, which can lead to immune infiltration, activate the immune system to kill tumor cells, and appear to be a favorable prognostic factor in gastric cancer. Although some studies of gastric cancer suggested that alterations in ARID1A caused better survival, 14 more studies supported that loss of ARID1A was an adverse prognostic factor. 16 Our present study showed that in the GS subtype, ARID1A negative expression resulted in worse OS and was an independent prognostic factor, whereas, in the other subtypes, ARID1A loss did not correlate with OS. This illustrated the complexity of the relationship between ARID1A and prognosis, which might be related to molecular background, treatment context, or potential confounders. In a study of liver cancer, 26 ARID1A was also found to have context‐dependent tumor suppressor and oncogenic roles. Histologically, the GS subtype mainly shows the diffuse type in Lauren's classification, with E‐cadherin frequently absent and more prone to EMT, ultimately leading to a worse prognosis. 4 , 27 Our study also found poor survival in the GS subtype, and the ARID1A negative group in the GS subtype showed the worst survival, which may account for the poor survival of the entire cohort by ARID1A negative. The ARID1A negative group within the GS subtype represents a particular subtype with the worst prognosis and requires more in‐depth molecular‐level studies.
Some studies on gastric adenocarcinoma found SWI/SNF complex abnormalities to be an independent prognostic factor for OS in the GS subtype. 28 , 29 Interestingly, ARID1A negative expression exhibited worse survival in the EBV subtype, 29 which was inconsistent with our present study, possibly due to different ARID1A classification methods or bias caused by too few patients in the subgroup. Large‐scale studies are needed to explore the complete molecular profile of gastric adenocarcinoma, confirm the prognostic significance of TCGA classification and ARID1A negative expression, and ultimately achieve risk stratification and more individualized patient management.
It has been well documented that the loss of ARID1A caused an increase in tumor‐infiltrating lymphocytes (TILs) and increased expression of PD‐L1. 30 Our present study also reached the same conclusion. However, our study showed the proportions of the MSI subtype and EBV subtype were significantly higher in the ARID1A negative group than in the ARID1A positive group, and it has been confirmed that the MSI subtype and EBV subtype can lead to high PD‐L1 expression and high TILs. 31 Therefore, to eliminate confounding factors, we performed subgroup analyses in TCGA subtypes and found that the expression of CD4 and PD‐L1 remained strongly associated with ARID1A expression in each subtype. In contrast, the expression of CD8 appeared to be independent of ARID1A status in each subtype. One study on ovarian cancer found that the relationship between ARID1A loss and CD8+ TILs was confounded by MMR status. 32 In another study on ovarian cancer, ARID1A was found to directly inhibit the expression of CD274 (the gene encoding PD‐L1). 33 More mechanistic studies related to immune regulation in gastric cancer are warranted. Our present study observed an inconsistent effect of ARID1A expression on the infiltration of CD4+ and CD8+ T cells in TCGA subtypes, implicating ARID1A involved in the immune infiltration through different mechanisms. Whether or to what extent the effects of ARID1A on TILs and PD‐L1 expression are influenced by confounding factors such as EBV and MMR is unclear, and more in‐depth investigations are still needed.
PD‐L1 expressed on tumor cells can inhibit the function of CD8+ T cells, leading to immune resistance and promoting tumor progression. 34 Consistent with a previous study, 35 , 36 our study also found a high PD‐L1 expression in gastric cancer infiltrated with CD8+ T cells, suggesting that adaptive immune resistance is active and can be counteracted by inhibiting PD‐1/PD‐L1. Further hierarchical analysis found that PD‐L1 was highly expressed in gastric carcinomas with high CD8+ T infiltration only when ARID1A was negative. We speculated that the loss of ARID1A increased PD‐L1 expression by activating Akt signaling, 37 further leading to immune resistance, 34 which is also one of the reasons for the poor prognosis of ARID1A‐negative patients. Another plausible explanation for the poor prognosis of ARID1A‐negative patients is that ARID1A negativity induced the suppression of critical genes responsible for chemotherapy and radiotherapy sensitivity, leading to radioresistance or chemoresistance of cancer cells. 36 , 38
Numerous studies of targeted therapies in a synthetic lethality manner have been conducted based on ARID1A mutation, 39 including poly polymerase, PI3K/AKT, Ataxia‐telangiectasia‐mutated‐and‐Rad3‐related kinase, enhancer of zeste homolog 2, and histone deacetylase 6, etc. Furthermore, due to the correlation between ARID1A and immune regulation, ARID1A may serve as a biomarker for immunotherapy. 40
The limitations of this study are as follows. First, the TMA is an economical and highly efficient method for protein expression analysis, especially in large‐scale cohorts. However, there is a discrepancy between the results of protein expression obtained from TMA and the real results due to the heterogeneity of gastric cancer. Second, we used IHC and EBER‐ISH for TCGA classification instead of high‐throughput molecular techniques. However, protein expression may be insufficient to represent the complex molecular changes. Finally, we screened out a subset of patients for mIF using random sampling and PSM instead of the entire cohort, which may lead to biased statistical results.
5. CONCLUSIONS
In summary, we detected the IHC expression of ARID1A in gastric adenocarcinoma and explored the impact of ARID1A negative expression on prognosis and immune infiltration in combination with TCGA molecular classification. Negative expression of ARID1A occurred more frequently in the EBV and MSI subtypes and was an independent adverse prognostic factor in the GS subtype. The ARID1A negative group in the GS subtype may represent a particular population with the worst prognosis. The high CD8 expression caused by ARID1A negative was mainly due to MSI and EBV subtypes, whereas the high expression of PD‐L1 and CD4 resulted more from ARID1A itself. The increase of CD8+ T cells infiltration caused by ARID1A negativity was accompanied by the increase of PD‐L1 expression, which might induce adaptive immune resistance that can be resisted by inhibiting PD‐1/PD‐L1.
AUTHOR CONTRIBUTIONS
Zhenkun Zhang: Conceptualization (supporting); data curation (equal); formal analysis (equal); investigation (equal); methodology (equal); validation (equal); writing – original draft (lead). Qiujing Li: Conceptualization (supporting); resources (equal); software (equal); validation (equal). Shanshan Sun: Data curation (equal); formal analysis (equal); investigation (equal); software (equal). Jing Ye: Conceptualization (supporting); resources (equal); validation (equal); writing – review and editing (supporting). Zhe Li: Data curation (equal); investigation (equal); writing – original draft (supporting). Zhengguo Cui: Methodology (equal); validation (equal); writing – review and editing (equal). Qian Liu: Resources (equal); software (equal). Yujie Zhang: Resources (equal); software (equal). Sili Xiong: Investigation (equal); software (equal). Shukun Zhang: Conceptualization (lead); data curation (equal); formal analysis (equal); methodology (equal); project administration (equal); supervision (equal); validation (equal); writing – review and editing (equal).
FUNDING INFORMATION
None.
CONFLICT OF INTEREST STATEMENT
The authors declare no conflicts of interest.
ETHICS STATEMENT
This study was approved by the Ethics Review Board of the Weihai Municipal Hospital (permission code: 2021053). The Ethics Review Board considered that informed consent for this study was not required due to its retrospective design.
Supporting information
Table S1.
Table S2.
Table S3.
Table S4.
Table S5.
Table S6.
Table S7.
Table S8.
Figure S1.
ACKNOWLEDGMENTS
Not applicable.
Zhang Z, Li Q, Sun S, et al. Prognostic and immune infiltration significance of ARID1A in TCGA molecular subtypes of gastric adenocarcinoma. Cancer Med. 2023;12:16716‐16733. doi: 10.1002/cam4.6294
DATA AVAILABILITY STATEMENT
The data are available on request from the corresponding author.
REFERENCES
- 1. Sung H, Ferlay J, Siegel RL, et al. Global cancer statistics 2020: GLOBOCAN estimates of incidence and mortality worldwide for 36 cancers in 185 countries. CA Cancer J Clin. 2021;71(3):209‐249. doi: 10.3322/caac.21660 [DOI] [PubMed] [Google Scholar]
- 2. Cancer Genome Atlas Research Network . Comprehensive molecular characterization of gastric adenocarcinoma. Nature. 2014;513(7517):202‐209. doi: 10.1038/nature13480 [DOI] [PMC free article] [PubMed] [Google Scholar]
- 3. Di Pinto F, Armentano R, Arborea G, Schena N, Donghia R, Valentini AM. Are immunohistochemical markers useful in phenotypic gastric cancer classification? Oncology. 2020;98(8):566‐574. doi: 10.1159/000506077 [DOI] [PubMed] [Google Scholar]
- 4. Birkman EM, Mansuri N, Kurki S, et al. Gastric cancer: immunohistochemical classification of molecular subtypes and their association with clinicopathological characteristics. Virchows Arch. 2018;472(3):369‐382. doi: 10.1007/s00428-017-2240-x [DOI] [PMC free article] [PubMed] [Google Scholar]
- 5. Mittal P, Roberts CWM. The SWI/SNF complex in cancer–biology, biomarkers and therapy. Nat Rev Clin Oncol. 2020;17(7):435‐448. doi: 10.1038/s41571-020-0357-3 [DOI] [PMC free article] [PubMed] [Google Scholar]
- 6. Reisman D, Glaros S, Thompson EA. The SWI/SNF complex and cancer. Oncogene. 2009;28(14):1653‐1668. doi: 10.1038/onc.2009.4 [DOI] [PubMed] [Google Scholar]
- 7. Ali SM, Sanford EM, Klempner SJ, et al. Prospective comprehensive genomic profiling of advanced gastric carcinoma cases reveals frequent clinically relevant genomic alterations and new routes for targeted therapies. Oncologist. 2015;20(5):499‐507. doi: 10.1634/theoncologist.2014-0378 [DOI] [PMC free article] [PubMed] [Google Scholar]
- 8. Ashizawa M, Saito M, Min AKT, et al. Prognostic role of ARID1A negative expression in gastric cancer. Sci Rep. 2019;9(1):6769. doi: 10.1038/s41598-019-43293-5 [DOI] [PMC free article] [PubMed] [Google Scholar]
- 9. Bosch F, Todorova R, Link H, et al. Molecular subtyping of gastric cancer with respect to the growth pattern of lymph‐node metastases. J Cancer Res Clin Oncol. 2019;145(11):2689‐2697. doi: 10.1007/s00432-019-03029-4 [DOI] [PMC free article] [PubMed] [Google Scholar]
- 10. Breiman L. Random forests. Machine Learning. 2001;45(1):5‐32. doi: 10.1023/A:1010933404324 [DOI] [Google Scholar]
- 11. Ishwaran H, Kogalur UB, Blackstone EH, Lauer MS. Random survival forests. The Annals of Applied Statistics. 2008;2(3):841‐860. doi: 10.1214/08-AOAS169 [DOI] [Google Scholar]
- 12. Jones S, Wang TL, Shih Ie M, et al. Frequent mutations of chromatin remodeling gene ARID1A in ovarian clear cell carcinoma. Science. 2010;330(6001):228‐231. doi: 10.1126/science.1196333 [DOI] [PMC free article] [PubMed] [Google Scholar]
- 13. Zhang ZM, Xiao S, Sun GY, et al. The clinicopathologic significance of the loss of BAF250a (ARID1A) expression in endometrial carcinoma. Int J Gynecol Cancer. 2014;24(3):534‐540. doi: 10.1097/IGC.0000000000000092 [DOI] [PubMed] [Google Scholar]
- 14. Wang K, Kan J, Yuen ST, et al. Exome sequencing identifies frequent mutation of ARID1A in molecular subtypes of gastric cancer. Nat Genet. 2011;43(12):1219‐1223. doi: 10.1038/ng.982 [DOI] [PubMed] [Google Scholar]
- 15. Wu RC, Wang TL, Shih IM. The emerging roles of ARID1A in tumor suppression. Cancer Biol Ther. 2014;15(6):655‐664. doi: 10.4161/cbt.28411 [DOI] [PMC free article] [PubMed] [Google Scholar]
- 16. Zhu YP, Sheng LL, Wu J, et al. Loss of ARID1A expression is associated with poor prognosis in patients with gastric cancer. Hum Pathol. 2018;78:28‐35. doi: 10.1016/j.humpath.2018.04.003 [DOI] [PubMed] [Google Scholar]
- 17. Kim KJ, Jung HY, Oh MH, et al. Loss of ARID1A expression in gastric cancer: correlation with mismatch repair deficiency and clinicopathologic features. J Gastric Cancer. 2015;15(3):201‐208. doi: 10.5230/jgc.2015.15.3.201 [DOI] [PMC free article] [PubMed] [Google Scholar]
- 18. Cajuso T, Hanninen UA, Kondelin J, et al. Exome sequencing reveals frequent inactivating mutations in ARID1A, ARID1B, ARID2 and ARID4A in microsatellite unstable colorectal cancer. Int J Cancer. 2014;135(3):611‐623. doi: 10.1002/ijc.28705 [DOI] [PubMed] [Google Scholar]
- 19. Bosse T, ter Haar NT, Seeber LM, et al. Loss of ARID1A expression and its relationship with PI3K‐Akt pathway alterations, TP53 and microsatellite instability in endometrial cancer. Mod Pathol. 2013;26(11):1525‐1535. doi: 10.1038/modpathol.2013.96 [DOI] [PubMed] [Google Scholar]
- 20. Shen J, Ju Z, Zhao W, et al. ARID1A deficiency promotes mutability and potentiates therapeutic antitumor immunity unleashed by immune checkpoint blockade. Nat Med. 2018;24(5):556‐562. doi: 10.1038/s41591-018-0012-z [DOI] [PMC free article] [PubMed] [Google Scholar]
- 21. Kase K, Saito M, Nakajima S, et al. ARID1A deficiency in EBV‐positive gastric cancer is partially regulated by EBV‐encoded miRNAs, but not by DNA promotor hypermethylation. Carcinogenesis. 2021;42(1):21‐30. doi: 10.1093/carcin/bgaa123 [DOI] [PubMed] [Google Scholar]
- 22. Kim TM, Jung SH, Kim MS, et al. The mutational burdens and evolutionary ages of early gastric cancers are comparable to those of advanced gastric cancers. J Pathol. 2014;234(3):365‐374. doi: 10.1002/path.4401 [DOI] [PubMed] [Google Scholar]
- 23. Yan HB, Wang XF, Zhang Q, et al. Reduced expression of the chromatin remodeling gene ARID1A enhances gastric cancer cell migration and invasion via downregulation of E‐cadherin transcription. Carcinogenesis. 2014;35(4):867‐876. doi: 10.1093/carcin/bgt398 [DOI] [PubMed] [Google Scholar]
- 24. Sasaki T, Kohashi K, Kawatoko S, et al. Tumor progression by epithelial‐mesenchymal transition in ARID1A‐ and SMARCA4‐aberrant solid‐type poorly differentiated gastric adenocarcinoma. Virchows Arch. 2022;480(5):1063‐1075. doi: 10.1007/s00428-021-03261-9 [DOI] [PubMed] [Google Scholar]
- 25. Simbolo M, Vicentini C, Ruzzenente A, et al. Genetic alterations analysis in prognostic stratified groups identified TP53 and ARID1A as poor clinical performance markers in intrahepatic cholangiocarcinoma. Sci Rep. 2018;8(1):7119. doi: 10.1038/s41598-018-25669-1 [DOI] [PMC free article] [PubMed] [Google Scholar]
- 26. Sun X, Wang SC, Wei Y, et al. Arid1a has context‐dependent oncogenic and tumor suppressor functions in liver cancer. Cancer Cell. 2018;33(1):151‐152. doi: 10.1016/j.ccell.2017.12.011 [DOI] [PMC free article] [PubMed] [Google Scholar]
- 27. Sohn BH, Hwang JE, Jang HJ, et al. Clinical significance of four molecular subtypes of gastric cancer identified by the cancer genome atlas project. Clin Cancer Res. 2017;23(15):4441‐4449. doi: 10.1158/1078-0432.CCR-16-2211 [DOI] [PMC free article] [PubMed] [Google Scholar]
- 28. Gluckstein MI, Dintner S, Arndt TT, et al. Comprehensive immunohistochemical study of the SWI/SNF complex expression status in gastric cancer reveals an adverse prognosis of SWI/SNF deficiency in Genomically stable gastric carcinomas. Cancers (Basel). 2021;13(15):3894. doi: 10.3390/cancers13153894 [DOI] [PMC free article] [PubMed] [Google Scholar]
- 29. Huang SC, Ng KF, Chang IY, et al. The clinicopathological significance of SWI/SNF alterations in gastric cancer is associated with the molecular subtypes. PLoS One. 2021;16(1):e0245356. doi: 10.1371/journal.pone.0245356 [DOI] [PMC free article] [PubMed] [Google Scholar]
- 30. Zhu Y, Yan C, Wang X, et al. Pan‐cancer analysis of ARID family members as novel biomarkers for immune checkpoint inhibitor therapy. Cancer Biol Ther. 2022;23(1):104‐111. doi: 10.1080/15384047.2021.2011643 [DOI] [PMC free article] [PubMed] [Google Scholar]
- 31. De Rosa S, Sahnane N, Tibiletti MG, et al. EBV(+) and MSI gastric cancers harbor high PD‐L1/PD‐1 expression and high CD8(+) intratumoral lymphocytes. Cancers (Basel). 2018;10(4):102. doi: 10.3390/cancers10040102 [DOI] [PMC free article] [PubMed] [Google Scholar]
- 32. Heinze K, Nazeran TM, Lee S, et al. Validated biomarker assays confirm that ARID1A loss is confounded with MMR deficiency, CD8(+) TIL infiltration, and provides no independent prognostic value in endometriosis‐associated ovarian carcinomas. J Pathol. 2022;256(4):388‐401. doi: 10.1002/path.5849 [DOI] [PMC free article] [PubMed] [Google Scholar]
- 33. Fukumoto T, Fatkhutdinov N, Zundell JA, et al. HDAC6 inhibition synergizes with anti‐PD‐L1 therapy in ARID1A‐inactivated ovarian cancer. Cancer Res. 2019;79(21):5482‐5489. doi: 10.1158/0008-5472.CAN-19-1302 [DOI] [PMC free article] [PubMed] [Google Scholar]
- 34. Topalian SL, Drake CG, Pardoll DM. Immune checkpoint blockade: a common denominator approach to cancer therapy. Cancer Cell. 2015;27(4):450‐461. doi: 10.1016/j.ccell.2015.03.001 [DOI] [PMC free article] [PubMed] [Google Scholar]
- 35. Thompson ED, Zahurak M, Murphy A, et al. Patterns of PD‐L1 expression and CD8 T cell infiltration in gastric adenocarcinomas and associated immune stroma. Gut. 2017;66(5):794‐801. doi: 10.1136/gutjnl-2015-310839 [DOI] [PMC free article] [PubMed] [Google Scholar]
- 36. Tokunaga R, Xiu J, Goldberg RM, et al. The impact of ARID1A mutation on molecular characteristics in colorectal cancer. Eur J Cancer. 2020;140:119‐129. doi: 10.1016/j.ejca.2020.09.006 [DOI] [PMC free article] [PubMed] [Google Scholar]
- 37. Kim YB, Ahn JM, Bae WJ, Sung CO, Lee D. Functional loss of ARID1A is tightly associated with high PD‐L1 expression in gastric cancer. Int J Cancer. 2019;145(4):916‐926. doi: 10.1002/ijc.32140 [DOI] [PubMed] [Google Scholar]
- 38. Watanabe R, Ui A, Kanno S, et al. SWI/SNF factors required for cellular resistance to DNA damage include ARID1A and ARID1B and show interdependent protein stability. Cancer Res. 2014;74(9):2465‐2475. doi: 10.1158/0008-5472.CAN-13-3608 [DOI] [PubMed] [Google Scholar]
- 39. Mullen J, Kato S, Sicklick JK, Kurzrock R. Targeting ARID1A mutations in cancer. Cancer Treat Rev. 2021;100:102287. doi: 10.1016/j.ctrv.2021.102287 [DOI] [PubMed] [Google Scholar]
- 40. Wang L, Qu J, Zhou N, Hou H, Jiang M, Zhang X. Effect and biomarker of immune checkpoint blockade therapy for ARID1A deficiency cancers. Biomed Pharmacother. 2020;130:110626. doi: 10.1016/j.biopha.2020.110626 [DOI] [PubMed] [Google Scholar]
Associated Data
This section collects any data citations, data availability statements, or supplementary materials included in this article.
Supplementary Materials
Table S1.
Table S2.
Table S3.
Table S4.
Table S5.
Table S6.
Table S7.
Table S8.
Figure S1.
Data Availability Statement
The data are available on request from the corresponding author.