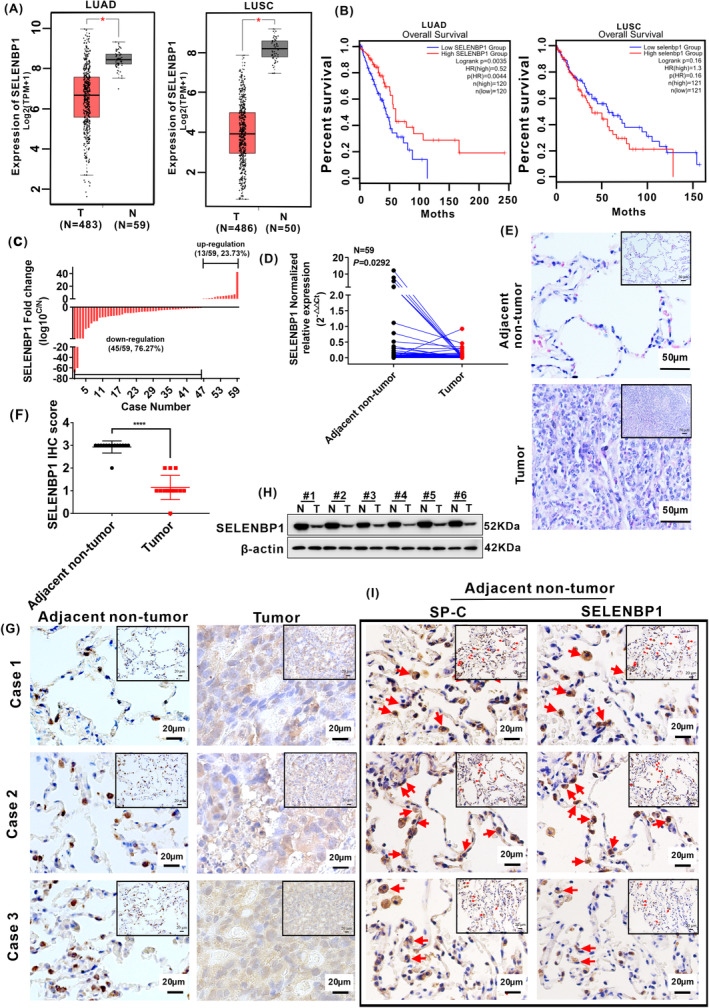
FIGURE 1.

SELENBP1 was downregulated in NSCLC tissues by a comprehensive analysis of TCGA database and collected clinical tissues. (A) The expression levels of SELENBP1 in 483 LUAD tissues (T) and 59 adjacent nontumor tissues (N), 486 LUSC tissues (T), and 50 adjacent nontumor tissues (N; Data were obtained from TCGA database) “*” p < 0.05. T versus N in both LUAD and LUSC, respectively. (B)The relationship between the overall survival (OS) rate of LUAD tissues (N = 240), LUSC tissues (N = 242), and the expression levels of SELENBP1, respectively. (C) The expression of SELENBP1 in 59 paired collected clinical tissues was arranged by log10 C/N. (C) the expression of SELENBP1 in NSCLC tumor tissues. N, the expression of SELENBP1 in paired adjacent nontumor tissues. (D) Total RNA was isolated from collected clinical NSCLC tumor tissues and paired nontumor tissues, and the expression of SELENBP1 was assessed by qRT‐PCR analysis (N = 59). Paired t‐test. (E) The histologic structure of NSCLC tumor tissues and paired adjacent nontumor tissues were evaluated by H&E staining (N = 14). Results of H&E staining were observed under a bright field microscope (×200), Scale bars, 50 μm. (F) The histogram was used to quantify the experimental results of IHC staining. Data were presented as the Mean ± SD, unpaired t‐test. “****” p < 0.001. Adjacent nontumor tissue versus tumor tissues. (G) The expressions of SELENBP1 in collected clinical NSCLC tumor tissues and paired adjacent nontumor tissues were evaluated by IHC staining (N = 14). Results of IHC staining were observed under a bright field microscope (×400), Scale bars, 20 μm. (H) The protein expression of SELENBP1 in collected clinical NSCLC tumor tissues and paired adjacent nontumor tissues were detected by western blotting (N = 6). (I) The serial paraffin sections of the paired adjacent nontumor tissues were subjected to IHC staining with antibodies against SP‐C and SELENBP1 (N = 3). Staining without primary antibody was used as negative controls. All results were observed under a bright field microscope (×400). Scale bars, 20 μm. Images are shown while representative positive stains are indicated by red arrows.
