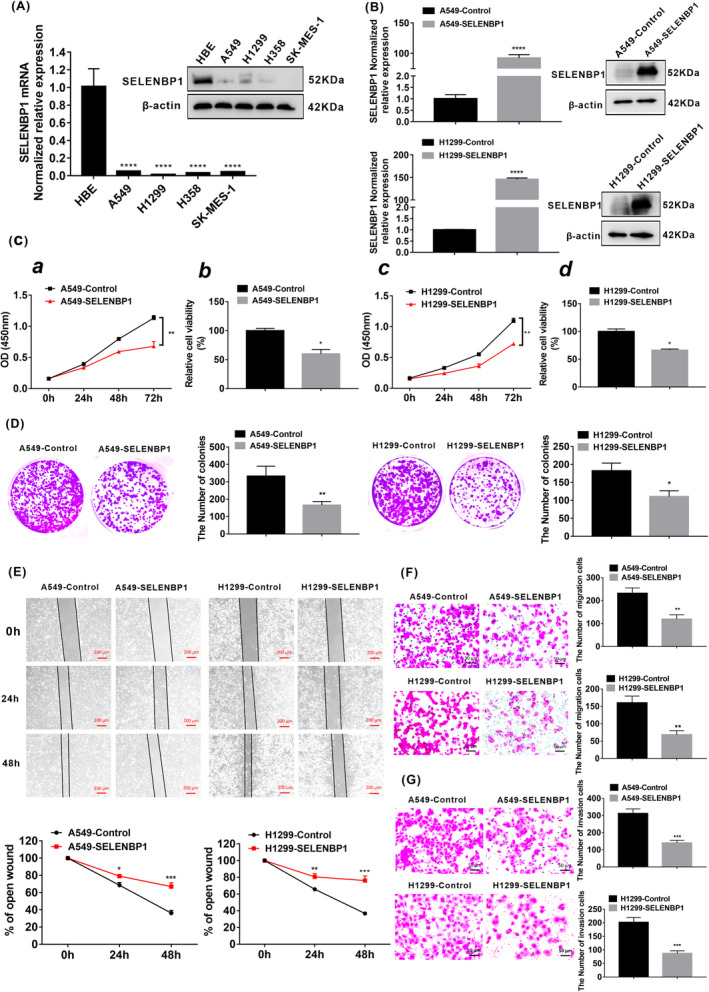
FIGURE 2.

Overexpression of SELENBP1 inhibited the proliferation, migration, and invasion of NSCLC cells in vitro. (A) The expression of SELENBP1 in four NSCLC cell lines A549, H1299, H358, and SK‐MES‐1 and normal lung cells HBE were measured by qRT‐PCR analysis and western blotting. β‐Actin was used as a control. All data were presented as the mean ± SD, unpaired t‐test, “****” p < 0.001, HBE group versus A549 group, H1299 group, H358 group, and SK‐MES‐1 group, respectively. (B) The expression of SELENBP1 in both A549‐SELENBP1 cells and H1299‐SELENBP1 cells and their control cells were measured by qRT‐PCR and western blotting after Lentivirus infection treatment. The total RNA and protein were extracted from the cells after puromycin screening. All data were presented as the mean ± SD, unpaired t‐test, “****” p < 0.001, A549‐Control group versus A549‐SELENBP1 group, H1299‐Control group versus H1299‐SELENBP1 group. (C) CCK8 assay. (a, c) CCK8 was performed at 0, 24, 48 and 72 h (N = 5). All data were presented as the mean ± SD, unpaired t‐test, “**” p < 0.01, A549‐Control group versus A549‐SELENBP1 group, H1299‐Control group versus H1299‐SELENBP1 group. (b, d) The histogram was used to quantify the cell viability (%) in 72 h. All data were presented as the mean ± SD, unpaired t‐test, “*” p < 0.05. A549‐Control group versus A549‐SELENBP1 group and H1299‐Control group versus H1299‐SELENBP1 group. (D) The number of cell clone in the A549‐SELENBP1 and H1299‐SELENBP1 and the control group were measured by clone forming assay (N = 3). All data were presented as the mean ± SD, unpaired t‐test, “*” p < 0.05, “**” p < 0.01, A549‐Control group versus A549‐SELENBP1 group and H1299‐Control group versus H1299‐SELENBP1 group. (E) The rate of open wounds (%) was measured by wound healing analysis (N = 3), and all data were presented as the mean ± SD, unpaired t‐test, “**” p < 0.01, “***” p < 0.005, A549‐Control group versus A549‐SELENBP1 group and H1299‐Control group versus H1299‐SELENBP1 group. Scale bars, 200 μm. (F) The number of migrated cells in A549‐SELENBP1, H1299‐SELENBP1, and control group was measured by Millicell assay (N = 3). And data were presented as the mean ± SD, unpaired t‐test “**” p < 0.01, A549‐Control group versus A549‐SELENBP1 group and H1299‐Control group versus H1299‐SELENBP1 group. Scale bars, 50 μm. (G) The number of invasion cells was measured by Transwell assay (N = 3). The data were presented as the mean ± SD, unpaired t‐test “***” p < 0.005, A549‐Control group versus A549‐SELENBP1 group and H1299‐Control group versus H1299‐SELENBP1 group. Scale bars, 20 μm. All experiments were repeated at least three times.
