FIGURE 4.

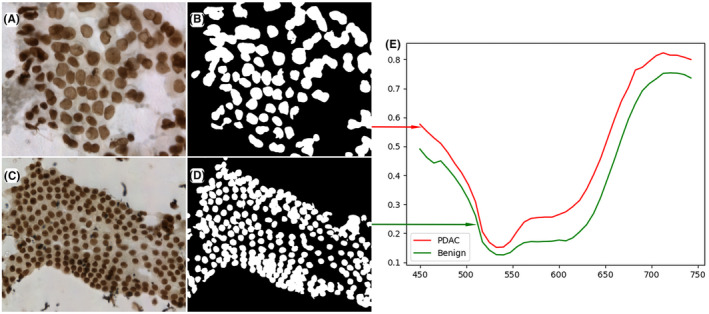
The representative spectrum features of benign pancreatic ductal/acinar cells and PDAC cells. (A) the pseudo‐color HSI images of PDAC cells; (B) the manual annotation masks of PDAC which are obtained by few‐shot GAN network; (C) the pseudo‐color HSI images of benign cells; (D) the manual annotation masks of benign; (E) The red curve represents the transmittance spectrum feature of PDAC in the hyperspectral images, and the spectrum feature of benign cells is the green curve.
