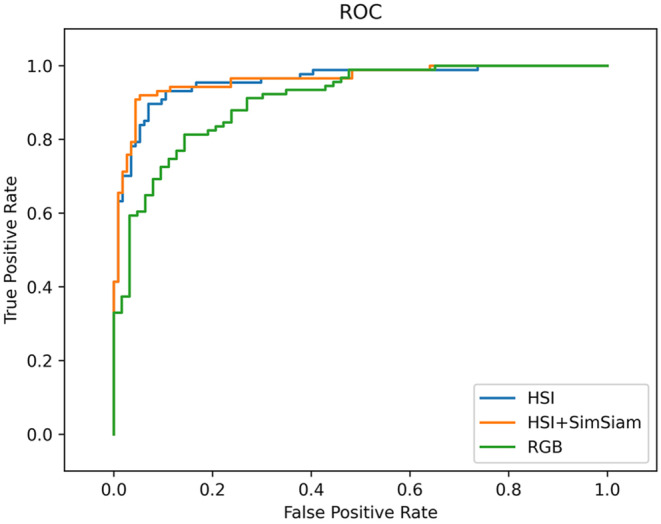
FIGURE 5.

Comparison of the receiver operating characteristic (ROC) curve of CNN model at the image level. Green curve represents ResNet18‐RGB with an area under the curve [AUC] of 0.9079, blue curve indicates ResNet18‐HSI with AUC of 0.9591, and orange curve is ResNet18‐HSI‐SimSiam model with an AUC‐ROC performance of 0.9625.
