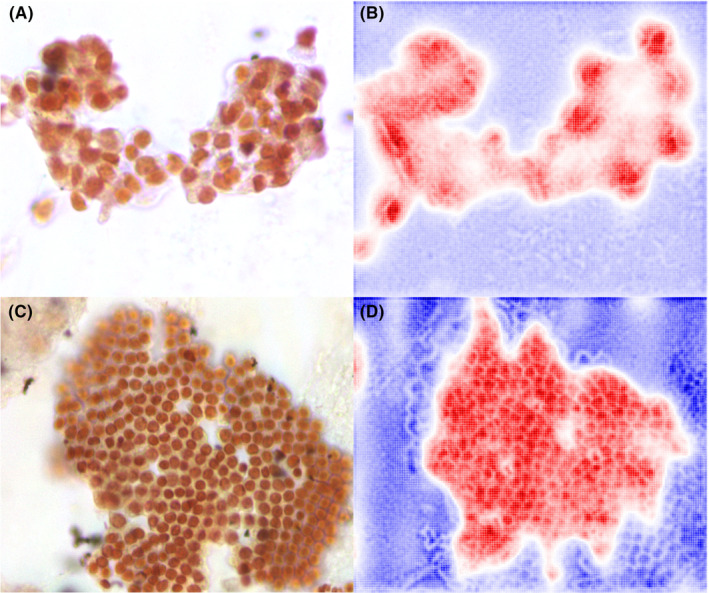
FIGURE 6.

Visualization of two cases using AGF‐Visualization on HSI‐based model. (A) original HSI image of PDAC case; (B) class activation map using the AGF‐Visualization for PDAC case; (C) the HSI image of benign case and (D) class activation map of benign case. The high intensity area (red color) reflects the area of interest to our model.
