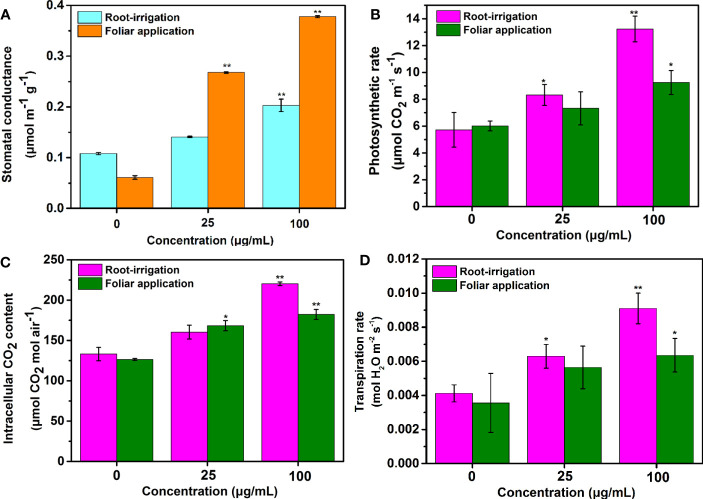
Figure 4.
(A) Stomatal conductance, (B) photosynthetic rate, (C) Ci content and (D) Tr of tobacco leaves on day 25 after the seedlings were treated with the tested concentrations of Mo NPs (0, 25 or 100 mg/L) under different application methods. ∗ and ∗∗ indicate significant differences between the control and Mo NPs treatments at the p< 0.05 and p< 0.01 levels according to one-way ANOVA followed by Tukey’s test.

