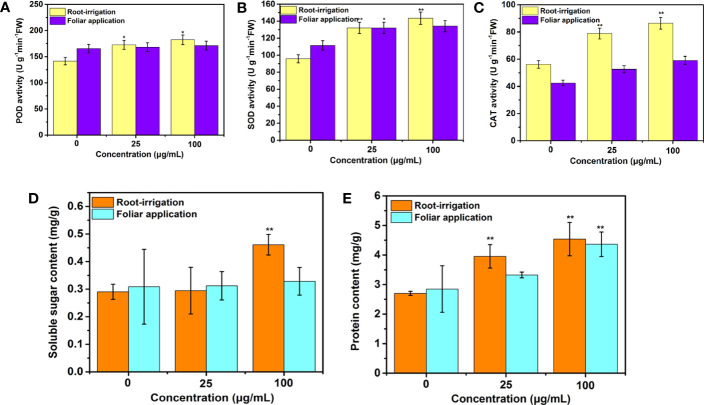
Figure 5.
(A) POD, (B) SOD, and (C) CAT activities and (D) soluble protein and (E) sugar contents in tobacco exposed to 0, 25, and 100 μg/mL Mo NPs for 25 days. Values represent the mean ± SD (n = 5). ∗ and ∗∗ indicate significant differences between the control and Mo NPs treatments at the p< 0.05 and p< 0.01 levels according to one-way ANOVA followed by Tukey’s test.

