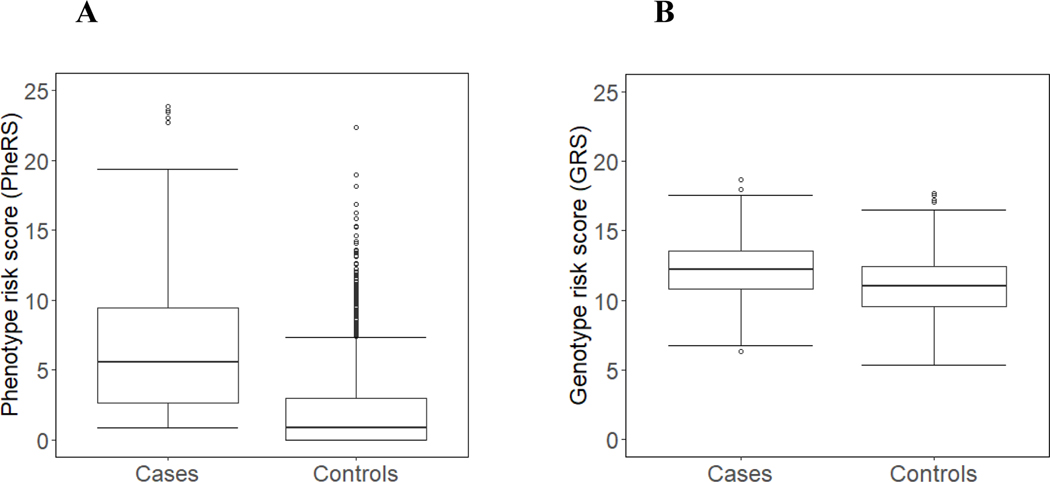
Figure 2. Boxplot of Systemic lupus erythematosus (SLE) phenotype risk scores (PheRS) in SLE cases vs. controls.
(A) We identified 789 SLE cases, all who had a SLE diagnosis confirmed by a rheumatologist. We identified 2,261 controls with no known autoimmune disease diagnoses. The horizontal line indicates the median score. (B) Boxplot of SLE genetic risk scores (GRS) in SLE cases vs. controls. Both SLE cases and controls were required to have genetic data available on MEGAEX chip. The genetic risk score consisted of 58 SLE risk SNPs with a 95% sampling and 95% call rate.

