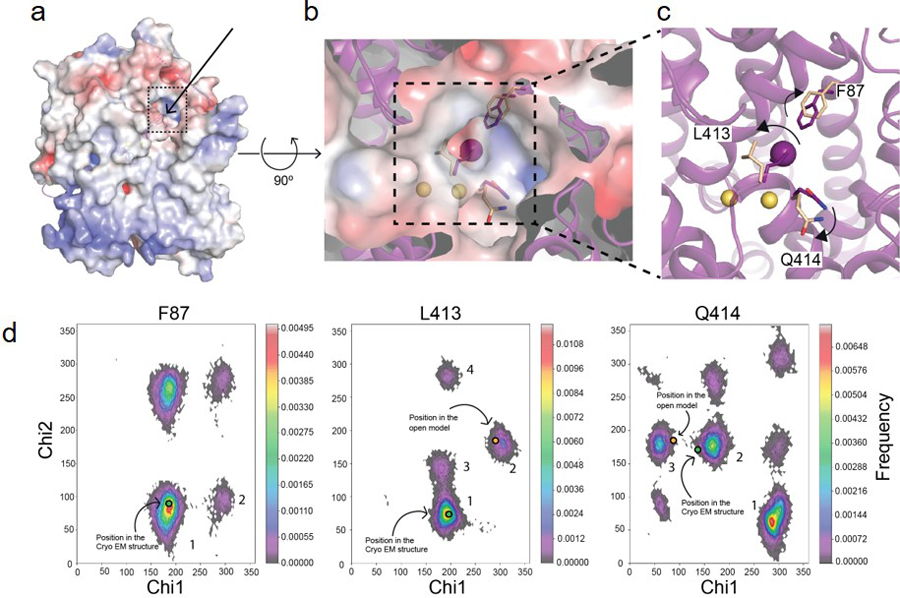
Extended Data Fig. 8 |. Entry pathway for the NIS substrates.

a. Surface representation of a side view of the NIS-I− structure: the arrow and the dotted square indicate the position of the proposed entry pathway. b. Close-up of the top view of the surface showing the substrates (Na+ ions represented by yellow spheres, I− by a magenta sphere), and the positions of F87, L413, and Q414 in the NIS-I− structure (magenta) and the models generated from MD simulations corresponding to the opening (wheat) of the substrate-binding cavity to the extracellular milieu. c. Magnification of the top of the substrate-binding cavity. The arrows indicate how the amino acids move away from their original positions as the cavity transitions from closed to open. d. Ramachandran plots of the chi-1 and chi-2 side chain dihedral angles of F87, L413, and Q414 visited during the MD simulations with NIS-I−. The dihedral angles selected are the principal determinants of the position of the side chain. The excursions of these dihedral angles (during the MD simulations) away from the conformational basins corresponding to the cryoEM structure (green dots in basins 1, 1, and 2, in F87, L413, and Q414, respectively) and toward conformational basins (blue dots in basins 1, 2, and 3, in F87, L413, and Q414, respectively) open up the entry path (b). In these histograms, the frequency of a given conformational state is indicated by a rainbow gradient from deep purple (0 frequency) to red (highest frequency); the most highly populated conformational basins are numbered in descending order of population.
