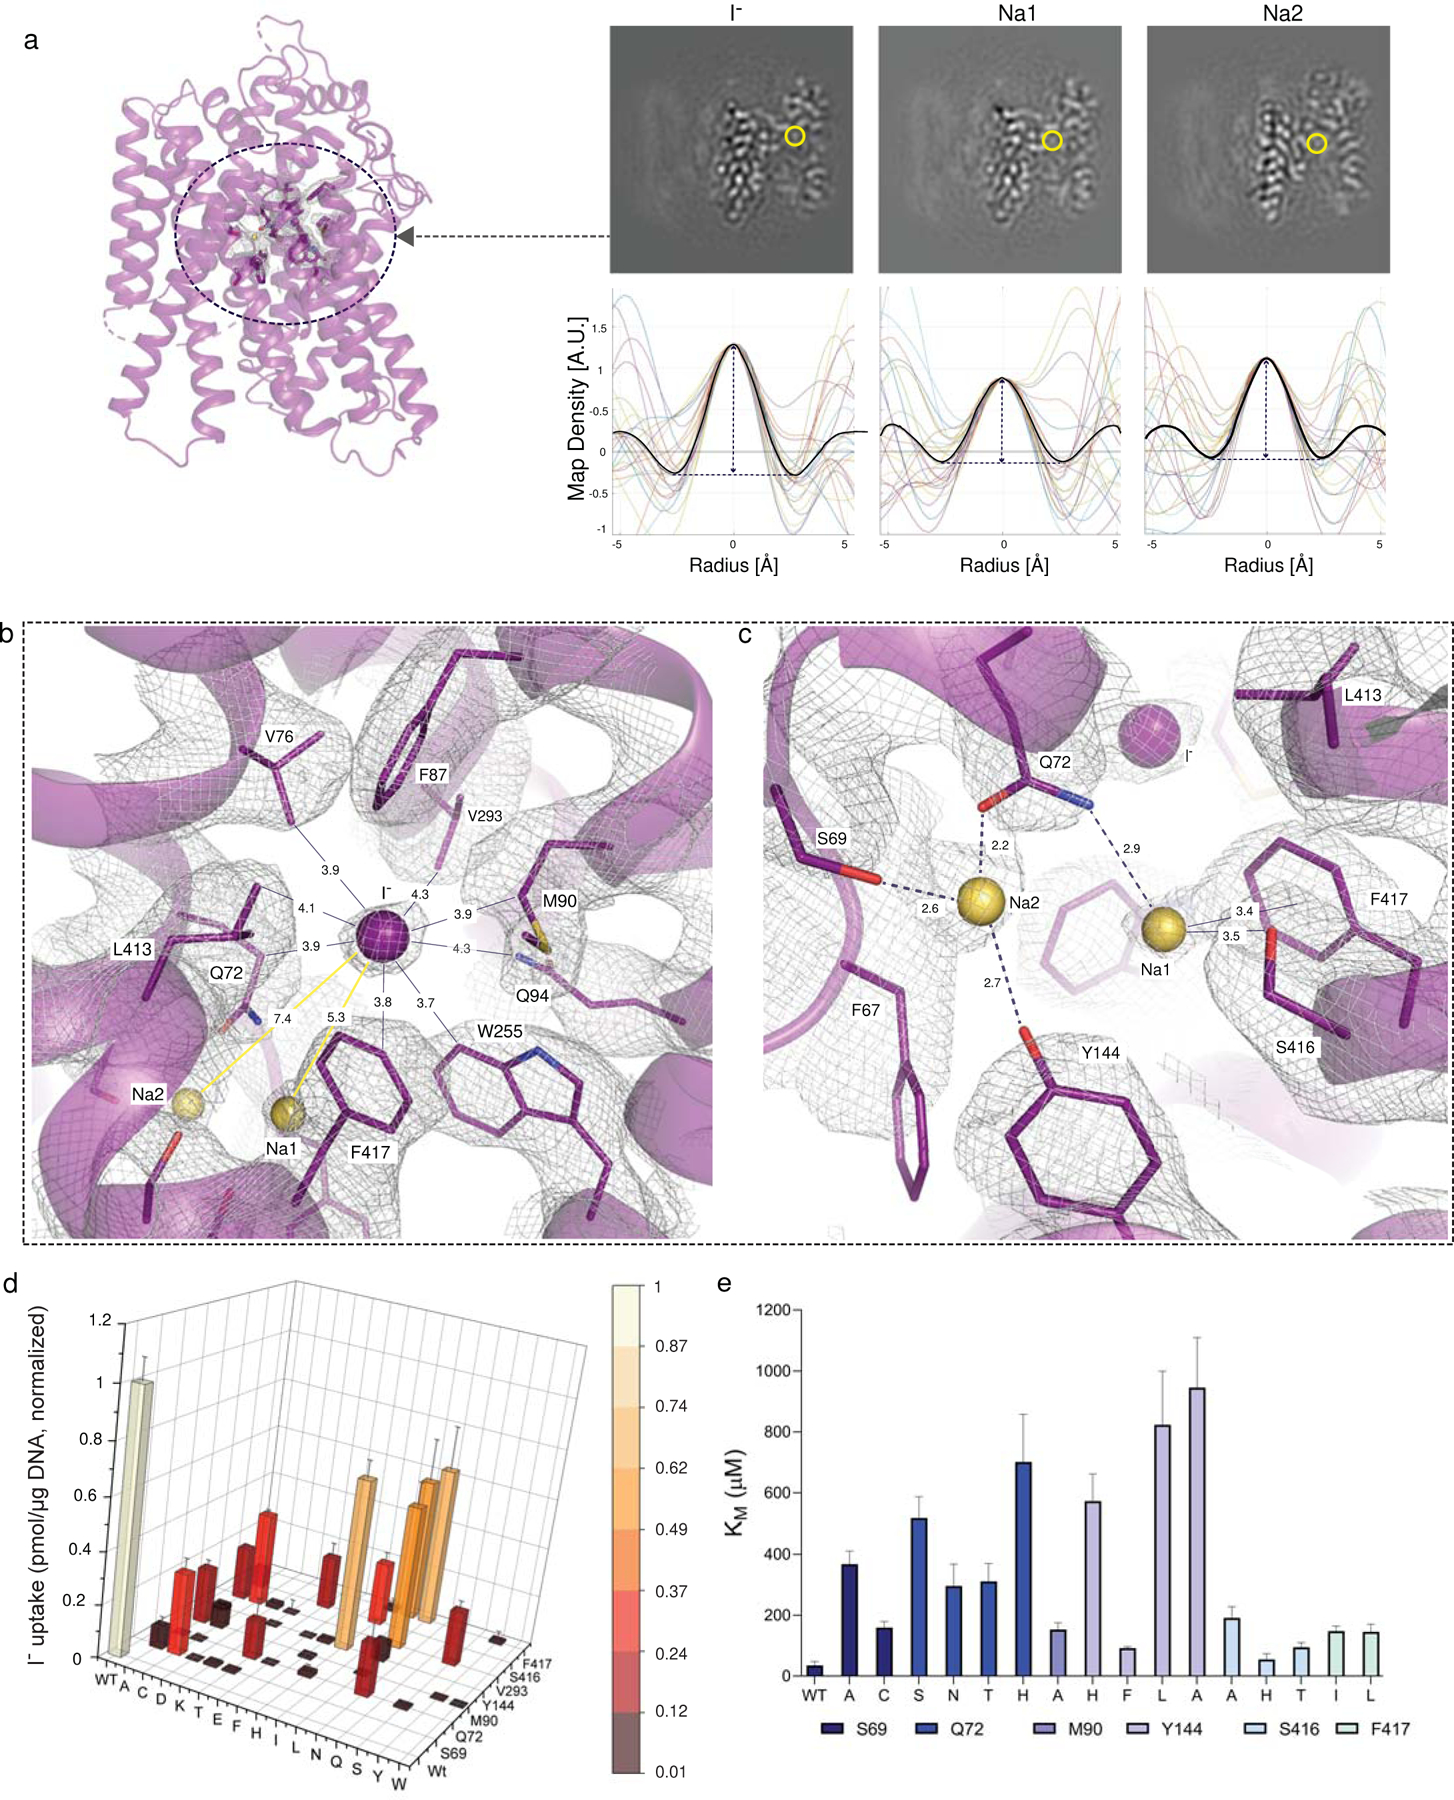
Fig. 2 │. Iodide and sodium binding sites. Fig. 2 | Iodide and sodium binding sites.

a. In the NIS-I− structure, the yellow circle indicates the substrate binding pocket. Ions transported by NIS were identified by analyzing the map density values (map slices in upper panels) along 24 lines passing through each site, circled in yellow. Map values are plotted for each line (lower panels), and the spherically-averaged mean is plotted in black. b. Close-up of the I− binding pocket, where I− is represented by the purple sphere. The distance (in Å) from I− to each surrounding residue is indicated. Yellow spheres represent sodium ions. c. Close-up of interactions between Na1 and Na2 and surrounding residues. d. Functional effects of mutations in binding-site residues. Steady-state transport was determined at 20 μM I− and 140 mM Na+ for 30 min, normalized to values obtained with WT NIS (values obtained in the presence of ClO4−, which are < 10% of the values obtained in its absence, have already been subtracted). Values represent averages of the results from two or three different experiments, each of which was carried out in triplicate (n ≥ 6) and reported as pmol I− accumulated/μg DNA ± s.e.m. e. KM values obtained from the kinetic analysis of I− transport; results are expressed as μM ± s.d. Error bars represent the standard deviation of the Michaelis-Menten analysis (n ≥ 6).
