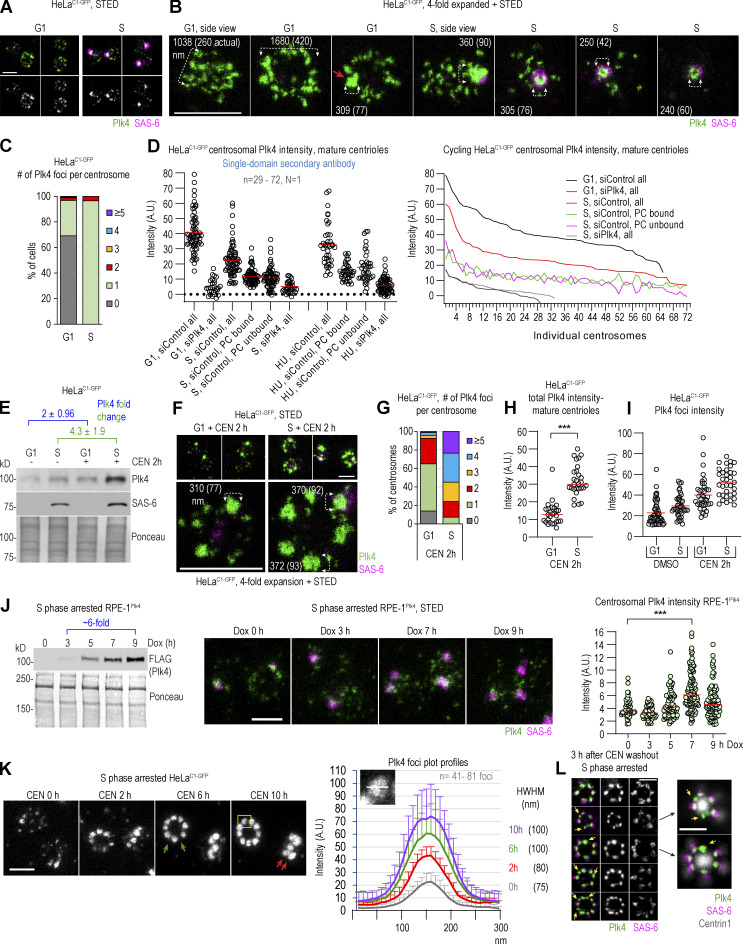
Figure 1.
Centrosomal distribution of Plk4 in its active and catalytically inhibited state. (A–I) Cycling G1 or S phase HeLaC1-GFP cells were treated with the Plk4 inhibitor CEN or DMSO (control) for the indicated time and immunolabeled for Plk4 and procentriole cartwheel protein SAS-6. (A and B) Distribution of centrosomal Plk4 and SAS-6 from control cells. (C) Quantification of Plk4 foci on centrosomes in G1 and S. (D) Quantification of the total, procentriole (PC)-bound, and PC-unbound Plk4 quantified from STED images. Line plot: The same data plotted as individual centrosomes. (E) Immunoblot analysis of Plk4 and SAS-6 from total cell extracts. Ponceau serves as a loading control. (F) Distribution of centrosomal Plk4 and SAS-6 in CEN-treated cells. (G) Quantification of Plk4 foci number per centrosome in CEN-treated cells. (H) Total Plk4 intensity on mature centrosomes quantified from STED images. (I) The intensity of individual Plk4 foci quantified from STED images. (J) Immunoblot of FLAG-Plk4 signal from total cell lysates. Expression of FLAG-Plk4 was induced by Dox for 0–9 h. Ponceau serves as a loading control. Middle: Images of centrosomes obtained from parallel samples. Right: Total Plk4 intensity on centrosomes quantified from STED images. The red line: average intensity. (K) STED images of immunolabeled Plk4 at centrosomes were recorded and used to measure intensity profiles for individual Plk4 foci (as shown in insert). Averaged intensity ± SD for each time point is plotted. The average size of Plk4 foci was determined at half-width–half-maxima of the plot profile. The green arrows indicate variable distances between adjacent Plk4 foci around the mother centriole. The red arrows point to Plk4 foci at different lateral positions along the mother centriole. (L) Plk4 foci and their association with SAS-6 after CEN washout. The yellow arrows point to Plk4 foci not associated with SAS-6. N = the number of independent replicates presented. n = the number of quantified centrosomes or Plk4 foci. Scale bars: 0.5 µm for STED and 2 µm for fourfold expansion + STED. Source data are available for this figure: SourceData F1.

