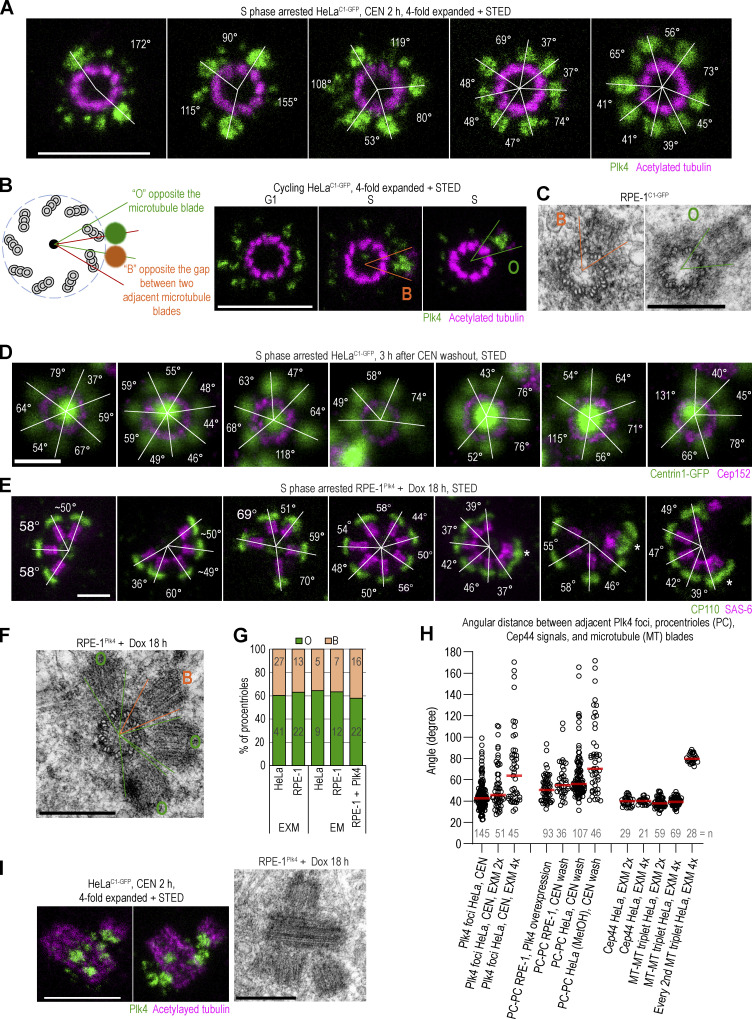
Figure 2.
Localization of Plk4 foci and procentrioles in relation to the mother centriole microtubule wall. (A) Images of Plk4 foci around centrioles after 2 h of CEN treatment. Samples were immunolabeled for Plk4, expanded, and postlabeled for acetylated tubulin. White lines connect the centers of Plk4 foci and the physical center of the mother centriole. The angles measured between two adjacent lines are indicated. (B) A schematic depicting two positions Plk4 foci and procentrioles occupy with respect to mother centriole microtubules. O = facing opposite microtubule blades. B = facing opposite the gap between microtubule triplets. Right: Examples of Plk4 foci/procentrioles in the B and O positions. (C) Electron micrographs of duplicated centrioles from RPE-1C1-GFP cells. One procentriole is in B and another in the O position. (D) Centriolar rosettes after transient CEN treatment. Cells were treated for 3 h, after which CEN was washed out to allow the formation of procentrioles around mother centrioles. Centrin1-GFP marks centrioles. Cep152 labeling was used to confirm the orthogonal orientation of mother centrioles. White lines and angles as in A. (E) Centriolar rosettes from Dox-induced Plk4-overexpressing RPE-1Plk4 cells. CP110 labels centriole distal ends and SAS-6 procentriole cartwheels. White lines and angles, as in A. Asterix marks overlapping procentrioles formed at different lateral highs. (F) Electron micrograph of a centriolar rosette from Plk4-overexpressing RPE-1Plk4 cells. (G) Quantification of procentrioles’ position around mother centriole. (H) Quantification of angles between adjacent Plk4 foci and procentrioles from various experiments. The angles were determined as indicated in A. Cep44 and acetylated tubulin signals exhibit an average angular distance of 40°, consistent with their symmetrical ninefold pattern, and were used to validate the quantification approach. (I) Plk4 and procentrioles at different lateral positions along the mother centriole longitudinal axis obtained by CEN treatment (STED images) or Dox-induced Plk4 overexpression (electron micrograph). Scale bars: 0.5 µm for STED, 2 µm for fourfold expansion + STED, and 0.4 µm for electron micrographs.

