Figure 3.
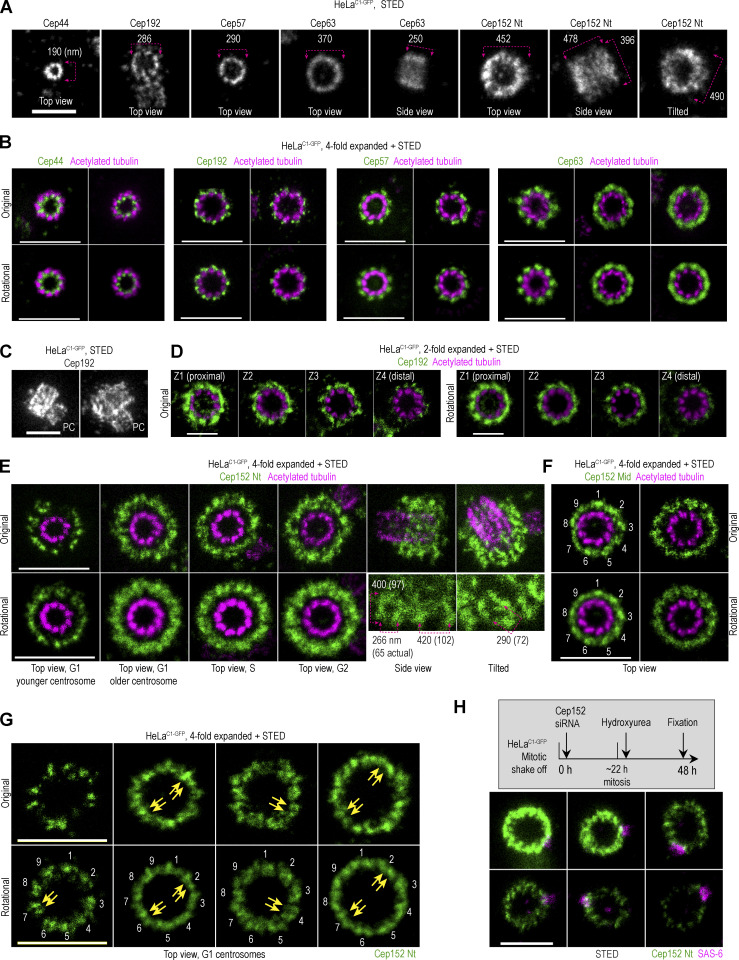
Spatial organization of proximal centriole proteins in HeLa cells. Logarithmically growing HeLaC1-GFP cells were immunolabeled with antibodies to detect Cep44, Cep192, Cep57, Cep63, or Cep152. Some samples were additionally expanded and labeled for acetylated tubulin. Imaging was done using STED. Rotational images of centrioles in the top view were additionally generated by averaging three images of the same centrosome rotated for 0°, 40°, and 80° (as depicted in Fig. S1 F). (A) Examples of fluorescent signals for various proteins. Nt = N-terminus. The outer diameter or lateral dimensions of the signals are indicated. (B) Original and averaged images of expanded centrioles imaged in the top view. (C) Images of centrosomes with duplicated mother centrioles immunolabeled for Cep192, which is localized on mother centrioles and procentrioles (PC). (D) Four Z sections of vertically oriented centrosomes illustrate different levels of Cep192 along the mother centriole. (E and F) Examples of expanded centrosomes with immunolabeled Cep152 using antibodies against the Nt or middle region (Mid; Fig. S1 A) and acetylated tubulin. Numbers in F indicate denser portions of the signal. (G) G1 centrosomes immunolabeled for Cep152 Nt. Numbers indicate nine groups of signals, with two adjacent signals within (some indicated by arrows). (H) Organization of Cep152 on centrosomes with various degrees of Cep152 depletion. Cep152 was depleted in HeLaC1-GFP cells, as depicted in the gray box. Cells were immunolabeled for Cep152 and procentriole marker SAS-6. Scale bars: 0.5 µm for STED, 1 µm for twofold expansion + STED, and 2 µm for fourfold expansion + STED.

