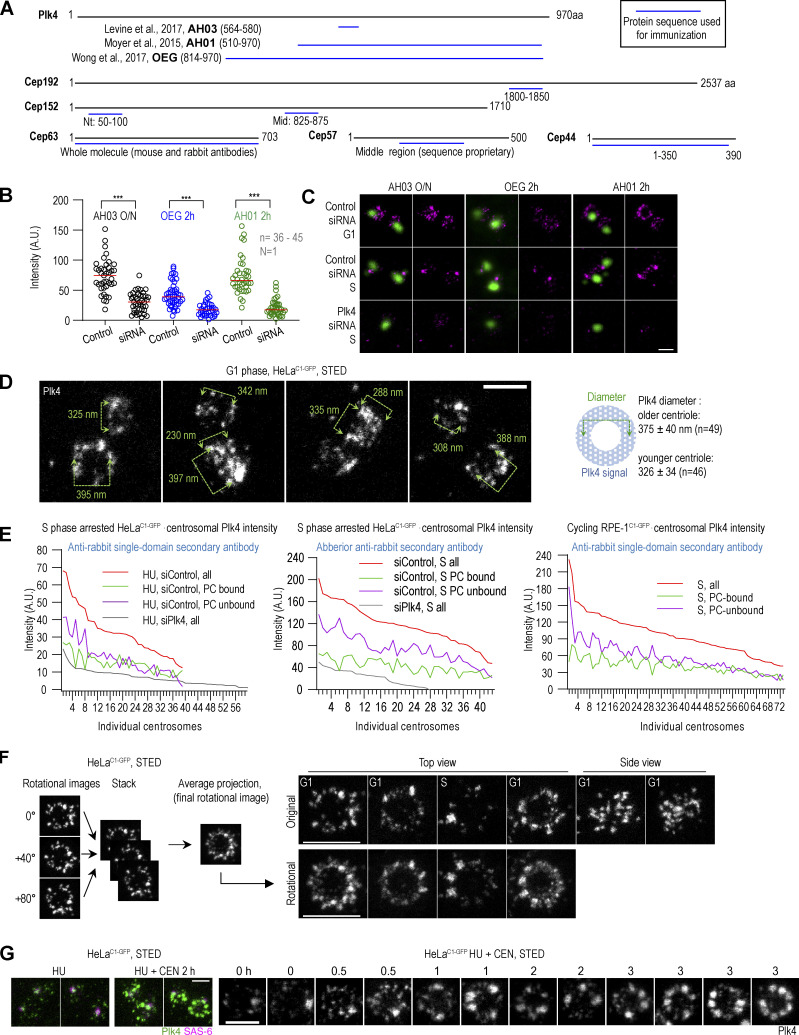
Figure S1.
Antibodies against Plk4 and other proteins and centrosomal Plk4 organization. (A) Schematic of peptides (blue lines) used to generate antibodies used in this paper. Sources and antibody nomenclature (bold letters) for custom Plk4 antibodies are indicated. (B and C) Cycling HeLaC1-GFP cells were synchronized by mitotic shake-off and treated with Plk4 siRNA for 40 h. Plk4 was immunolabeled with indicated Plk4 antibodies for 2 h at 37°C or overnight at 4°C (O/N), followed by incubation with fluorescently labeled secondary antibodies. (B) Quantification of centrosomal Plk4 signals from STED images. In Plk4 siRNA-treated samples, only cells with one centrosome were included in the analysis to ensure that Plk4 was depleted. Box and whisker plot shows the minimum and maximum value, median, upper, and lower quartiles, and all data points, including outliers. n = number of centrosomes; N = number of independent experiments. (C) STED images of Plk4 immunolabeled centrosomes in non-depleted and depleted cells. Centrin1-GFP signal marks centrioles’ position. (D) Plk4 was immunolabeled in a population of G1 cells, and centrosomal Plk4 was imaged using STED. The numbers on the figure panels indicate the dimensions of the Plk4 signal between the points indicated by arrows. The centriole containing more Plk4 is likely the older centriole. The average diameter ± SD of Plk4 signals of older and younger centrioles is indicated. (E) S phase arrested HeLaC1-GFP and cycling RPE-1C1-GFP cells were fixed and immunolabeled for Plk4 and imaged by STED. The total, procentriole (PC)-bound, and PC-unbound Plk4 was quantified, and the data was plotted for individual centrosomes. (F) The left panel illustrates the strategy used to generate rotational images of centrosomal signals of centrioles imaged in vertical or near-vertical orientation with respect to the imaging plane. Centrioles were centered in the middle of the canvas. Three rotational images of the centrioles were generated by rotating images for 0°, 40°, and 80°, assembled in a stack, and an average projection was made. Right: Original and rotated images of Plk4 signals from cycling cells. (G) S phase arrested HeLaC1-GFP cells were treated with Plk4 inhibitor CEN for up to 3 h, immunolabeled for Plk4 and SAS-6 (procentriole marker), and centrosomes were analyzed by STED. HU = hydroxyurea. Scale bars: 0.5 µm for STED and 2 µm for fourfold expansion + STED.

