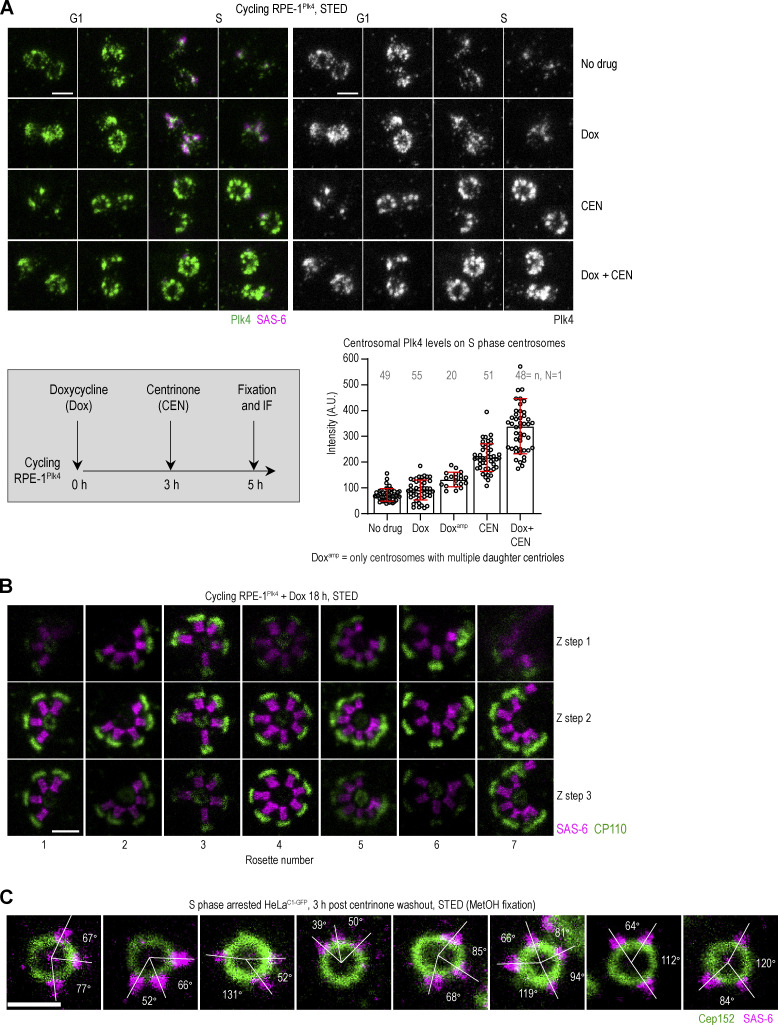
Figure S2.
Centrosomal organization of catalytically uninhibited and inhibited overexpressed Plk4 and centriolar rosettes. (A) Centrosomal organization of overexpressed Plk4 in the absence and in the presence of its catalytic inhibitor CEN. S phase arrested RPE-1Plk4 cells were treated as depicted in the gray box. Dox was added to induce Plk4 expression, after which CEN was added to inhibit Plk4. Cells were fixed and immunolabeled for Plk4 and SAS-6 and imaged using STED. The centrosomal intensity of Plk4 was measured from STED images and plotted. The plot shows all individual points and average ± SD. n = number of centrosomes; N = number of independent experiments. (B) Three Z sections of centriolar rosettes from Plk4-overexpressing RPE-1Plk4 cells. The middle Z section is shown in Fig. 2 C. CP110 labels centriole distal ends and SAS-6 labels procentriole cartwheels. (C) Organization of centriolar rosettes induced by a transient CEN treatment after fixation in methanol (MetOH). S phase arrested cells were treated with CEN for 3 h, after which CEN was washed out to allow the formation of procentrioles around mother centrioles for 3 h. Cells were immunolabeled for Cep152 and SAS-6 and imaged by STED. White lines connect the centers of SAS-6 foci and the physical center of the mother centriole. The angles measured between two adjacent lines are indicated. Scale bars: 0.5 µm.

