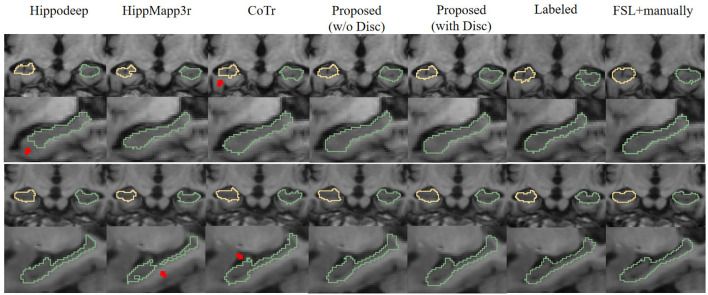
Figure 6.
Visual contour and comparison of different segmentation methods on two examples subjects. The first and second rows are from the first subject, and the third and fourth rows are from the second subject. The first and third rows display the coronal slices of the left and right hippocampus, while the second and fourth rows display segmentation in sagittal slices. Manually traced ground truth is displayed in the penultimate column on the right. Annotation getting from FSL and manual correction results are shown in the right most column. The reason for including this “FSL+manually” column is to enable the consistent comparison of the dataset without too many manual annotations: see text in Section 3.1.2 for details. The red arrows indicate the over- or under-segmentation error.

