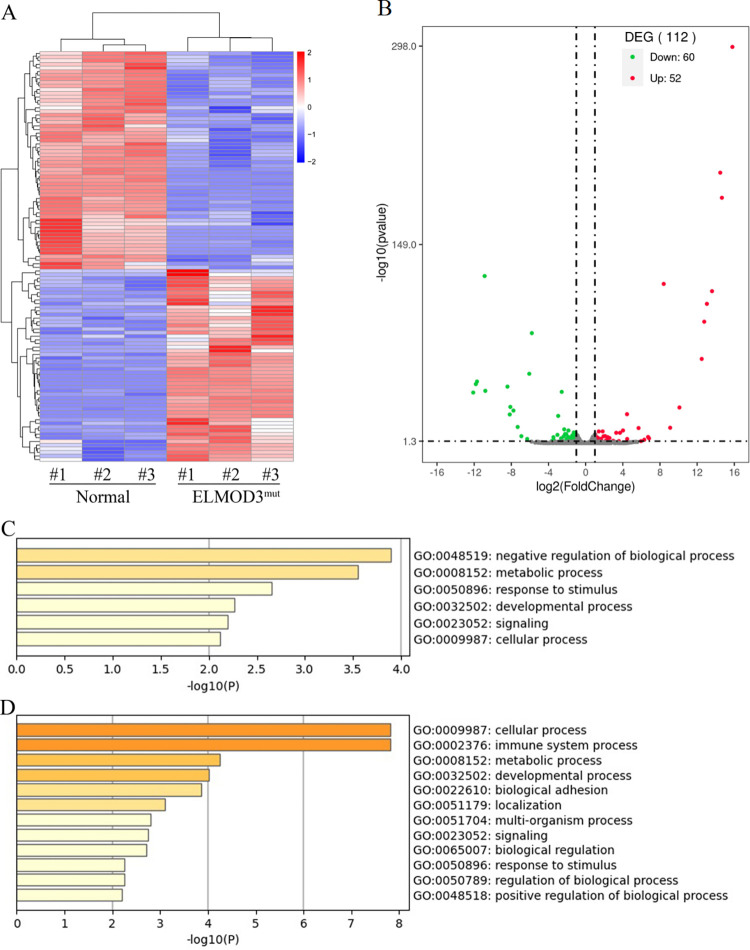
Fig 3. Differentially expressed genes between ELMOD3mut and control iPSCs.
(A) The heatmap showed a hierarchical clustering analysis of DEGs in ELMOD3mut iPSCs. Red and blue indicate genes with high and low expression levels, respectively. (B) Volcano plot showing the expression change of each gene and their significance. Red dots represent the expression of genes in ELMOD3mut iPSCs significantly up-regulated compared to normal control. Green dots represent the expression of genes in ELMOD3mut iPSCs significantly down-regulated compared to normal control. (C-D) GO enrichment analysis of differently expressed genes in ELMOD3mut iPSCs. GO terms enriched with up-regulated genes are shown in (C). GO terms enriched with down-regulated genes are shown in (D).

