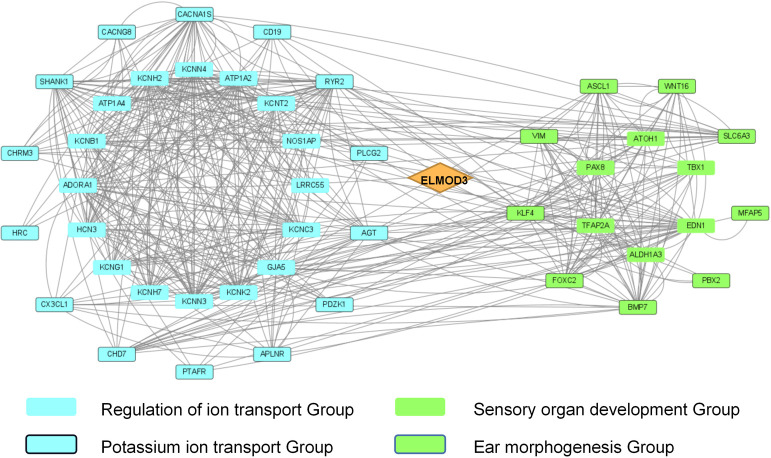
Fig 6. Integrated analysis of specific gene sets in DEGs of ELMOD3mut and ELMOD3corrected iPSCs.
The diamond represents ELMOD3. The blue square represents the genes enriched in the GO term regulation of ion transport, and the blue square with the frame indicates genes related to potassium ion transport. The green square represents the genes enriched in the GO term sensory organ development, and the green square with the frame indicates genes related to ear morphogenesis.

