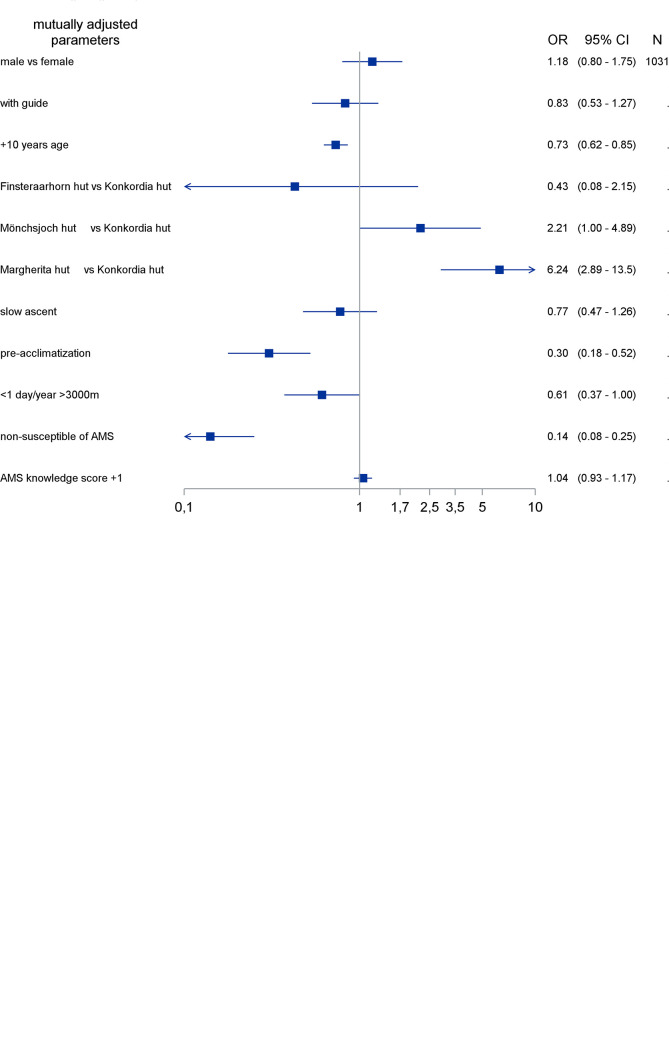
Fig 2.
Analysis of risk factors for developing AMS based on the AMS-C score (2a) and the LLS (2b), respectively. The X-axis represents the odds ratio (OR); each row on the Y-axis represents an individual factor. The black boxes represent point estimates and corresponding 95% confidence intervals (CIs) of the individual factors. The effect of age was analyzed as age in years divided by 10 (1 unit change representing 10 years age difference).

