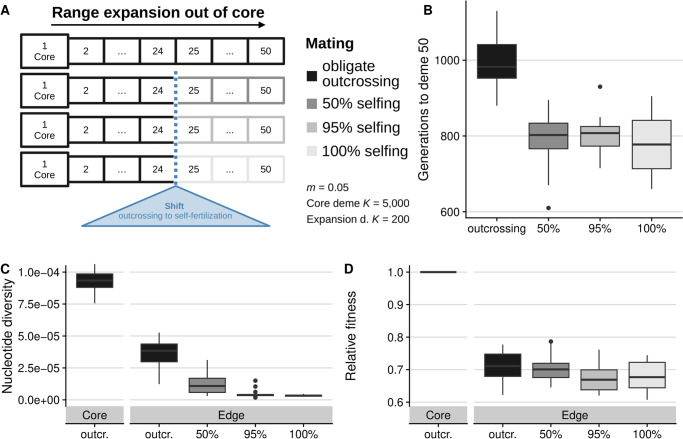
Fig 1.
Simulation schematic for 1-D landscapes with stepping-stone migration (A). A shift in the rate of self-fertilization occurs in the center of the landscape (blue triangle). The number of generations needed to cross the landscape from the core to deme 50 (B). Expansion time was lower for all selfing rates but higher for obligate outcrossing. Mean nucleotide diversity (C) was reduced outside of the core, with a greater reduction for higher selfing: . Relative fitness (D) decreased from core to edge with similar values across outcrossers and selfers: , reflecting a relative loss of fitness as compared to the core of 29.1%, 29.8%, 32.4%, and 31.7% respectively for σ = 0, 0.5, 0.95, and 1.

