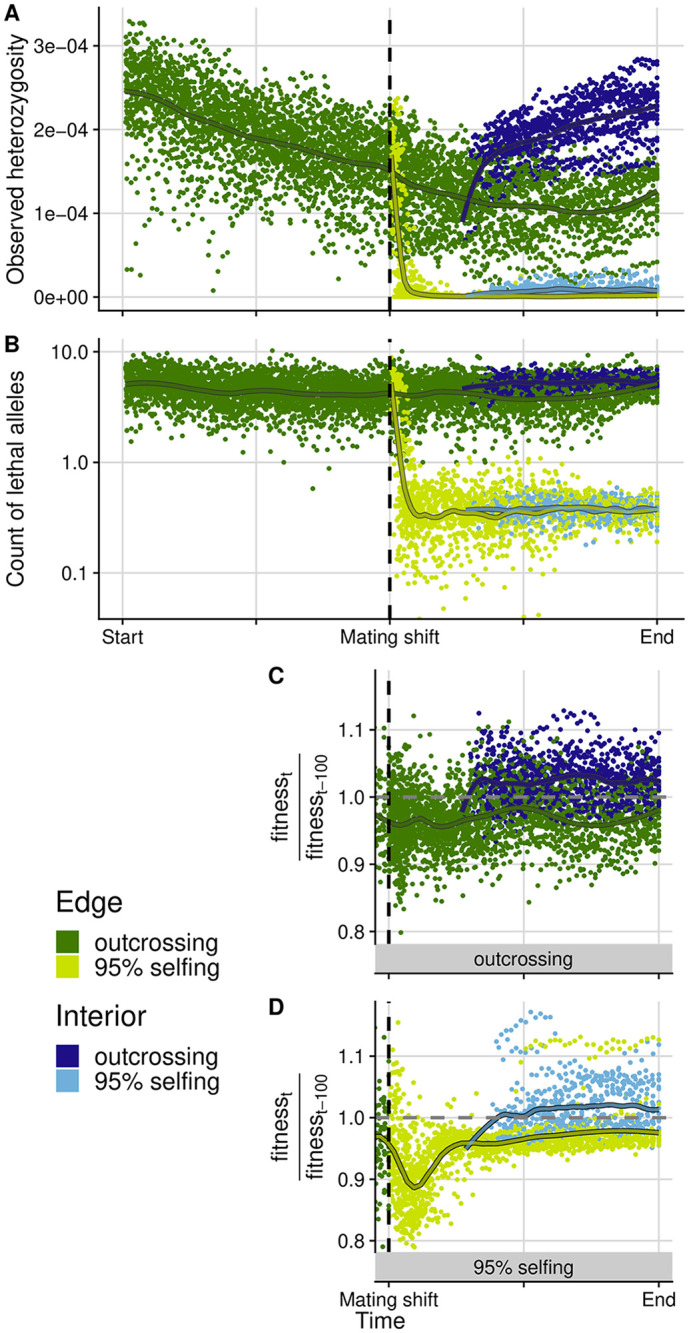
Fig 2.

Observed heterozygosity (A), count of lethal alleles (B), and the rate of fitness change (C-D) are shown through time for the expanding range edge (green) as compared to change over time within one interior deme, stationary on the landscape (blue, deme 35). For selfing rates 50% and 100%, see S3 and S4 Figs. Panels (C) and (D) show the rate of fitness change as measured over 100-generation intervals, separately for outcrossers and selfers. A value of 1 indicates no change in fitness over 100 generations while values above 1 indicate increasing fitness and values below 1 indicate fitness loss. The vertical dashed line indicates the point in time where the mating system shifts to selfing. This shift occurs at deme 25 on the landscape, and since there is variation across simulation replicates in the generation time taken to expand to deme 25, we plotted all values relative to this time point for each replicate shown (n = 20 replicates per selfing rate scenario). Each point is the value from a single simulation replicate and lines are loess (span = 0.2) fitted curves across all replicates.
