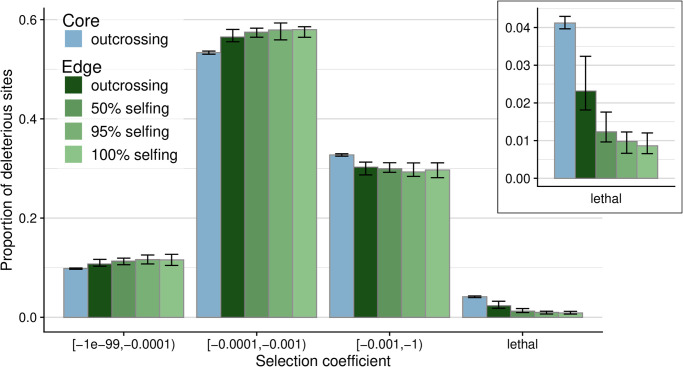
Fig 3. The observed distribution of selection coefficients from simulations at the end of expansion.
The core deme (blue) is compared to edge demes (green) for obligate outcrossing (darkest color) versus higher selfing rates (lighter colors). Error bars indicate 0.05 and 0.95-quantiles across the 20 simulation replicates. The inset panel emphasizes the degree to which the proportion of sites in the lethal category changes over mating system scenario from core to edge.

