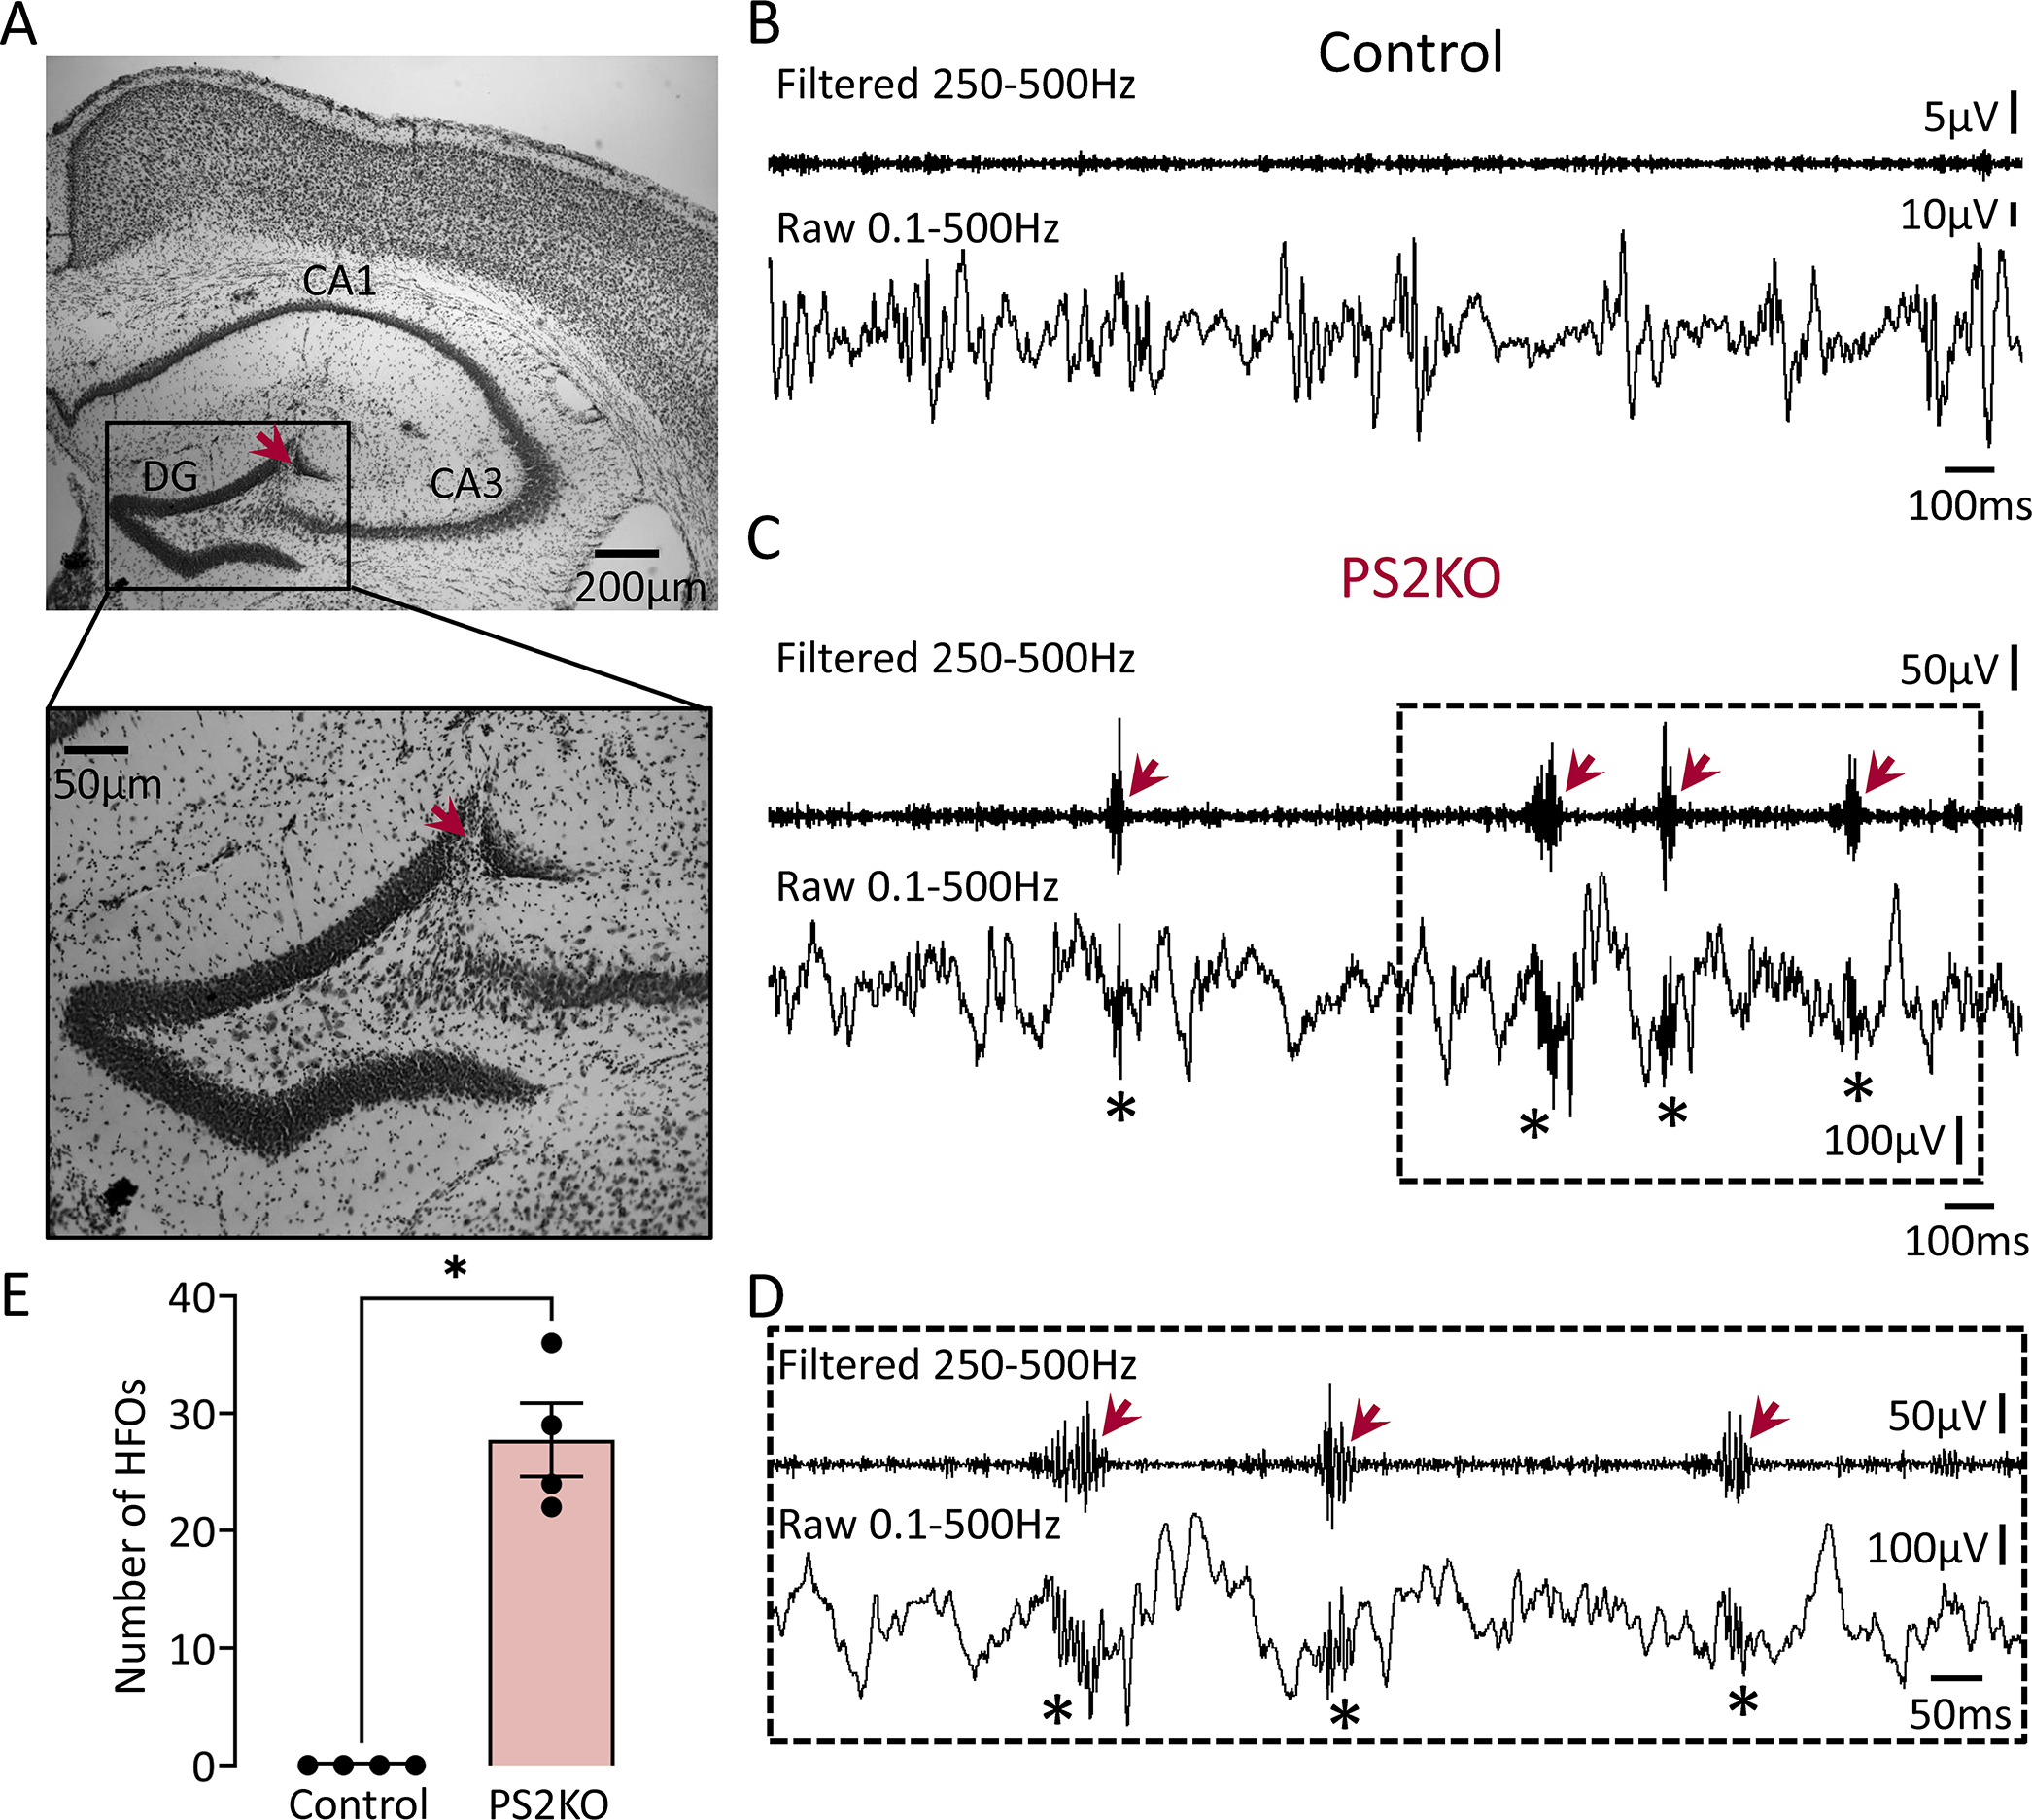
Figure 2: HFOs in the dentate gyrus of PS2KO mice.

(A) A representative Nissl-stained section confirming electrode placement in the DG (red arrow). Electrode targeting for both the control and transgenic mice is provided in Supplemental figure 3.
(B) A representative EEG recording from the DG of a control mouse during SWS. Note the absence of HFOs in filtered and raw traces.
(C) Same as in B but the mouse was a PS2KO transgenic. Note the presence of HFOs in the filtered (red arrows) and raw traces (asterisks). Please note that the difference in amplitude between PS2KO transgenic and control is because mice were recorded using different recording systems. As we explain in Methods, comparisons were possible across recording systems since normalized data were not significantly different across systems. Please see Methods for more details.
(D) Expanded traces from the inset in C are shown. Note that HFOs (red arrows) stand out from baseline in the filtered trace.
(E) Total number of HFOs recorded from control (n=4) and PS2KO transgenic (n=4) mice. Data from all behavioral states were pooled. The total number of HFOs was significantly higher in PS2KO vs. control mice (Mann-Whitney U-test, U=0, p=0.02).
