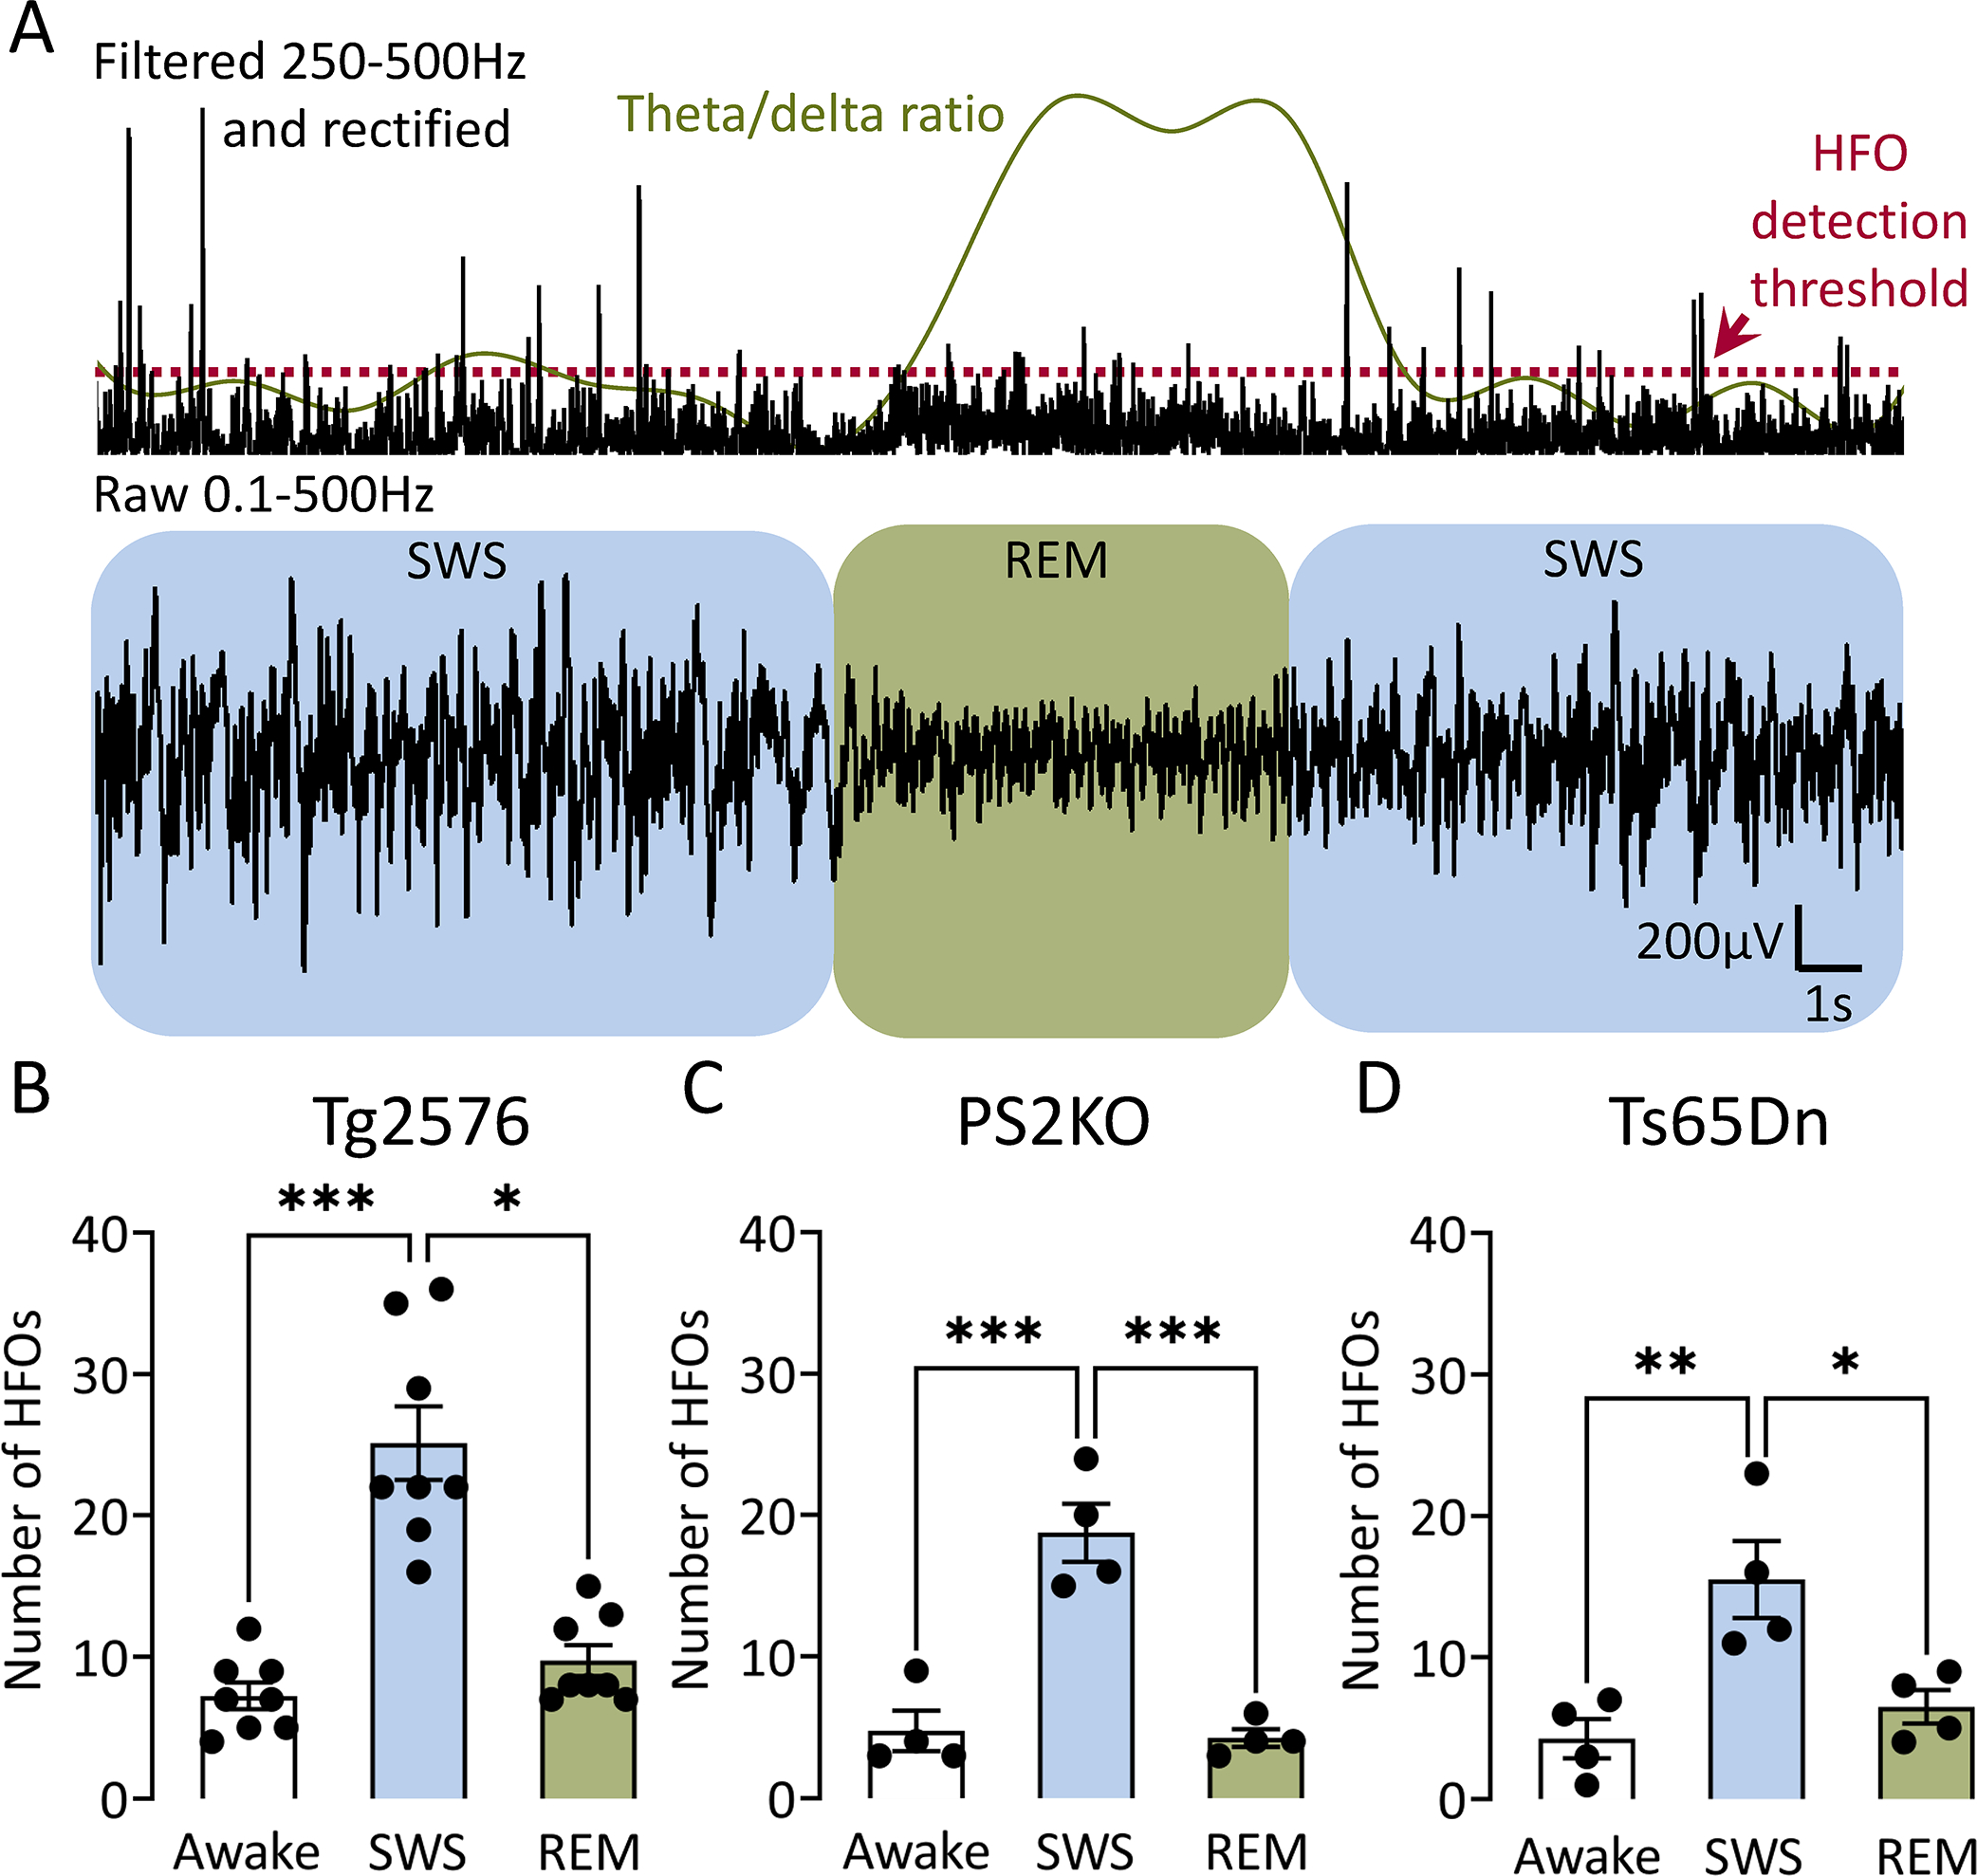
Figure 4: The number of HFOs in AD mouse models is elevated during slow wave sleep.

(A) Top trace is filtered in the 250–500Hz frequency, rectified to show HFOs during a representative sleep period that includes both SWS (blue) and REM (green). Detection threshold for HFOs is denoted by a red dotted line and theta/delta ratio by a green line. Bottom trace shows raw EEG during SWS (blue) and REM (green). Note frequent HFOs during SWS and reduced number of HFOs during REM, which corresponds to an increased theta/delta ratio.
(B) Number of HFOs during wakefulness, SWS and REM sleep in Tg2576 transgenic mice (n=8). One-way ANOVA revealed a significant difference (Kruskal-Wallis test, H(3)=16.56, p=0.0003) and post-hoc tests showed a significantly greater number of HFOs during SWS vs. REM (p=0.01) or wakefulness (p=0.0003). There was no significant difference between the mean number of HFOs in wakefulness vs. REM (p=0.90).
(C) Same as in B but for PS2KO transgenic mice (n=4). One-way ANOVA revealed a significant difference (F(2, 9)=30.39, p<0.0001). Post-hoc tests showed a significantly greater number of HFOs during SWS vs. REM (p=0.0002) or wakefulness (p=0.0002), but not between wakefulness and REM (p=0.81).
(D) Same as in C but for Ts65Dn transgenic mice (n=4). One-way ANOVA revealed a significant difference (F(2, 9)=9.90, p<0.01). Post-hoc tests showed a significantly greater number of HFOs during SWS vs. REM (p=0.02) or wakefulness (p=0.006), but not wakefulness and REM (p=0.80).
