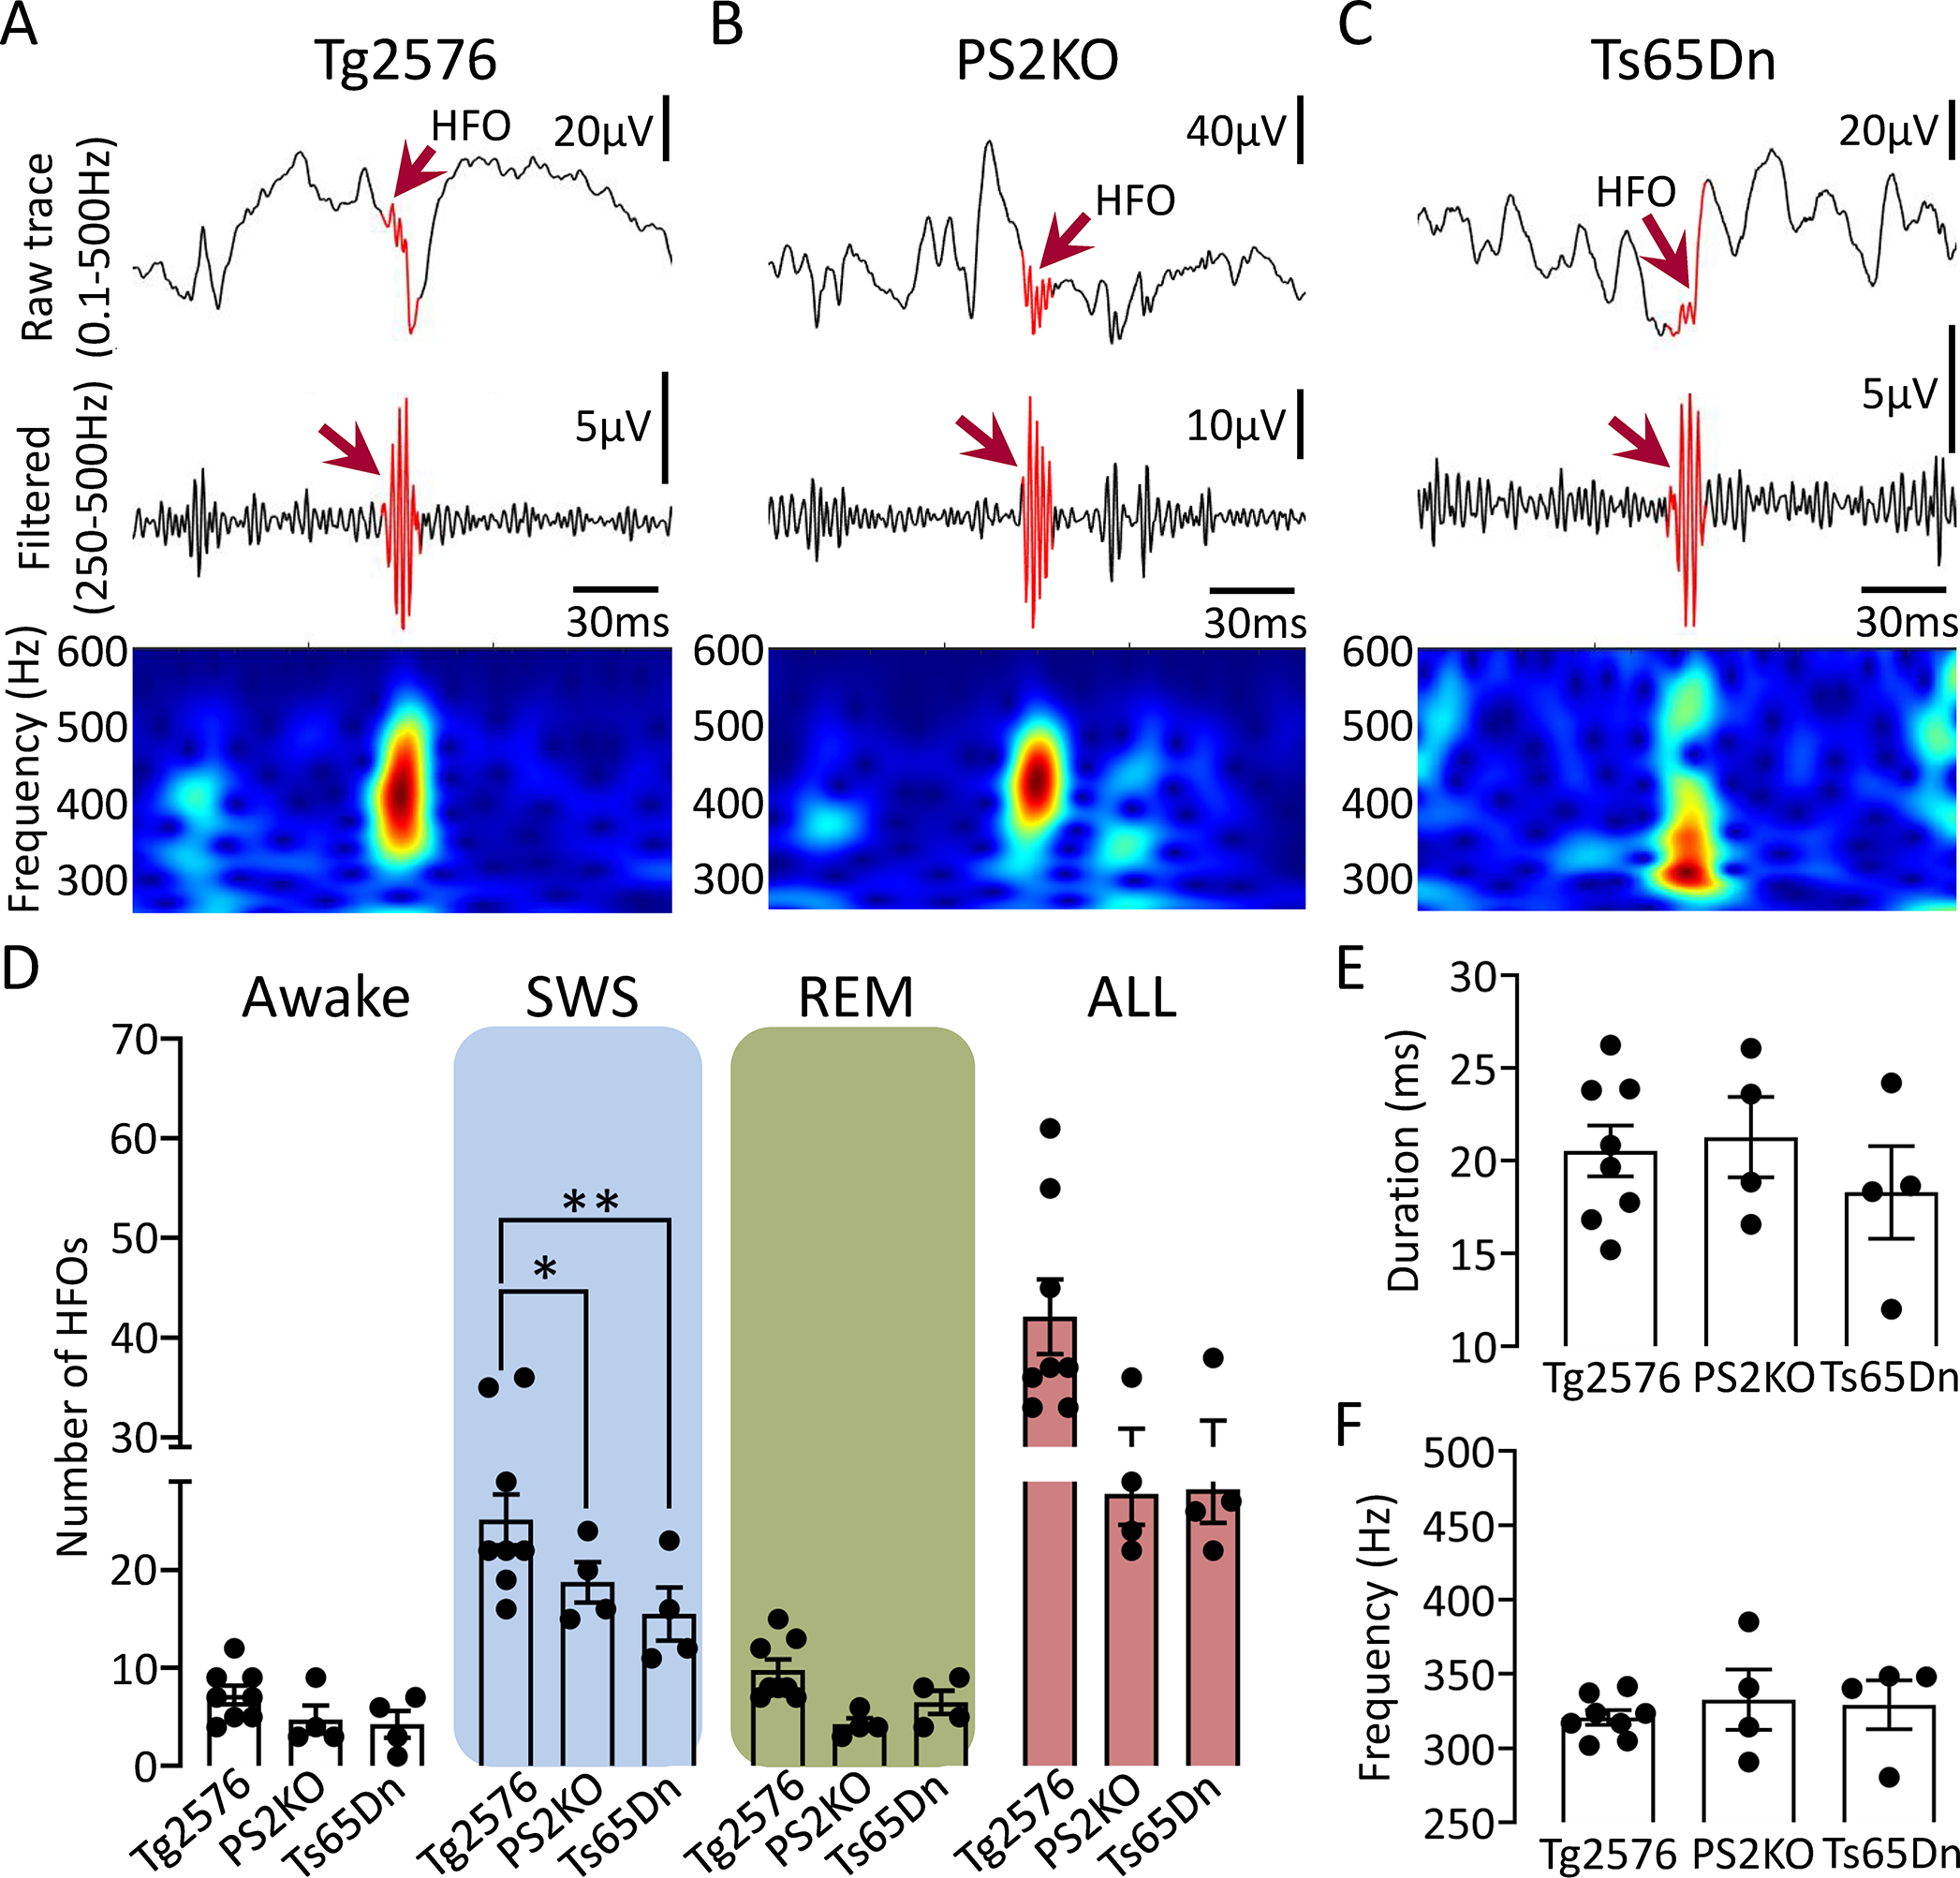
Figure 5: Comparison of spectral frequency, number and duration of HFOs between different AD mouse models.

(A) Representative example of an HFO (red arrow) recorded in the DG of a Tg2576 transgenic mouse. Top trace is wideband recording (0.1–500Hz). The center is a filtered trace (250–500Hz), and at the bottom are spectral properties of the HFO in the 250–600Hz time-frequency domain.
(B) Same as in A but for an HFO recorded from a PS2KO transgenic mouse.
(C) Same as in B but for an HFO recorded from a Ts65Dn transgenic mouse.
(D) Number of HFOs during wakefulness, SWS, REM and all states combined (“All”) between different models. A two-way ANOVA with model and behavioral state as factors showed a significant effect for model (F(2, 39)=8.45, p=0.0009) and behavioral state (F(2, 39)=49.86, p<0.0001) with no significant interaction (F(4, 39)=1.21, p=0.32). Post-hoc comparisons showed that HFOs during wakefulness or REM were not significantly different between models (all comparisons; p>0.05). However, SWS HFOs were significantly different between Tg2576 vs. PS2KO (p=0.04) and Ts65Dn (p=0.001) mice. The total number of HFOs in all behavioral states (“All”), pooled, was significantly different between models (F(2, 13)=4.97, p=0.02) but post-hoc tests did not confirm statistically significant differences in the number of HFOs in Tg2576 vs. PS2KO (p=0.06), and Ts65Dn mice (p=0.07).
(E) HFO duration during SWS between different mouse models. No significant differences were found between models (One-way ANOVA, F(2, 13)=0.54, p=0.59).
(F) Spectral frequency of HFOs during SWS in different mouse models. No significant differences were found (Kruskal-Wallis test, H(3)=0.90, p=0.66).
