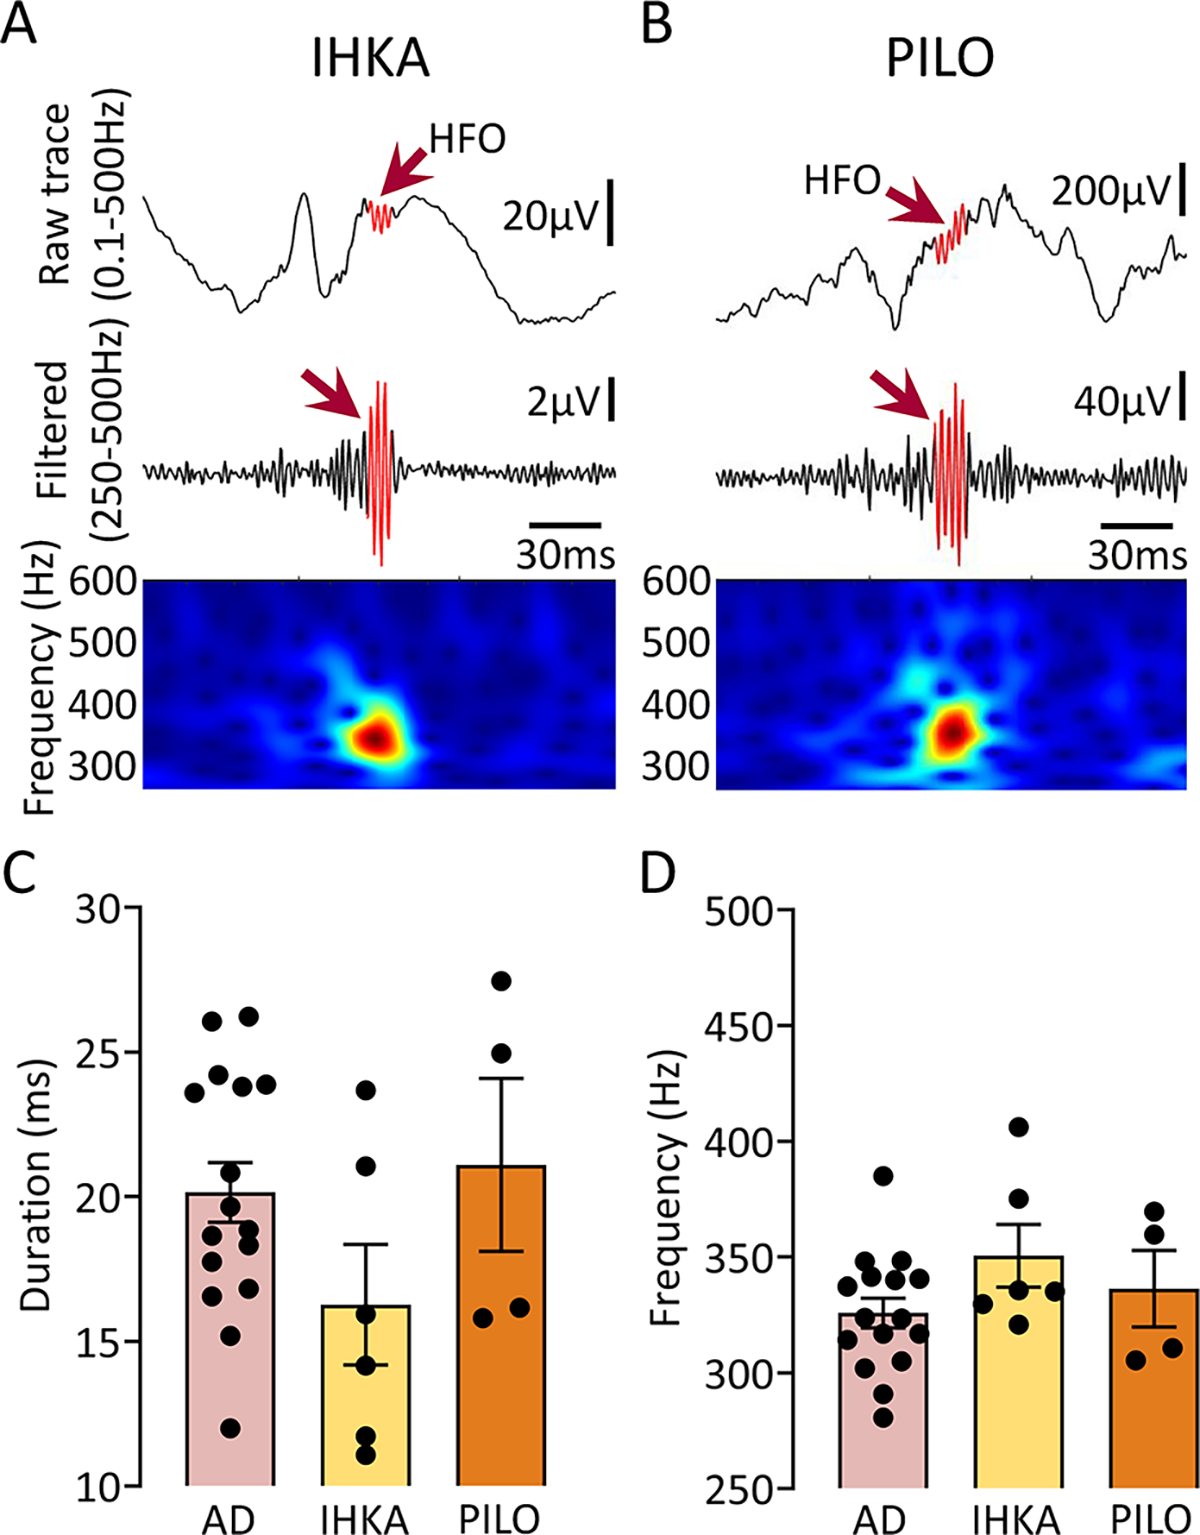
Figure 6: HFOs in the AD mouse models closely resemble HFOs in 2 animal models of epilepsy.

(A) Representative example of an HFO (red arrow) recorded from the hippocampus of a mouse where kainic acid was injected. Top trace is wideband recording (0.1–500Hz). The center is filtered trace (250–500Hz), and bottom shows spectral properties of the HFO in the 250–600Hz time-frequency domain.
(B) Same as in A but for an HFO recorded from the hippocampus of a PILO-treated mouse.
(C) Comparison of HFO duration between AD, IHKA and PILO models. One-way ANOVA found no significant differences in HFO duration between models (F(2, 23)=1.84, p=0.18).
(D) Same as in C but for spectral frequency. As in the case of HFO duration, one-way ANOVA found no significant differences between models (F(2, 23)=1.66, p=0.21).
