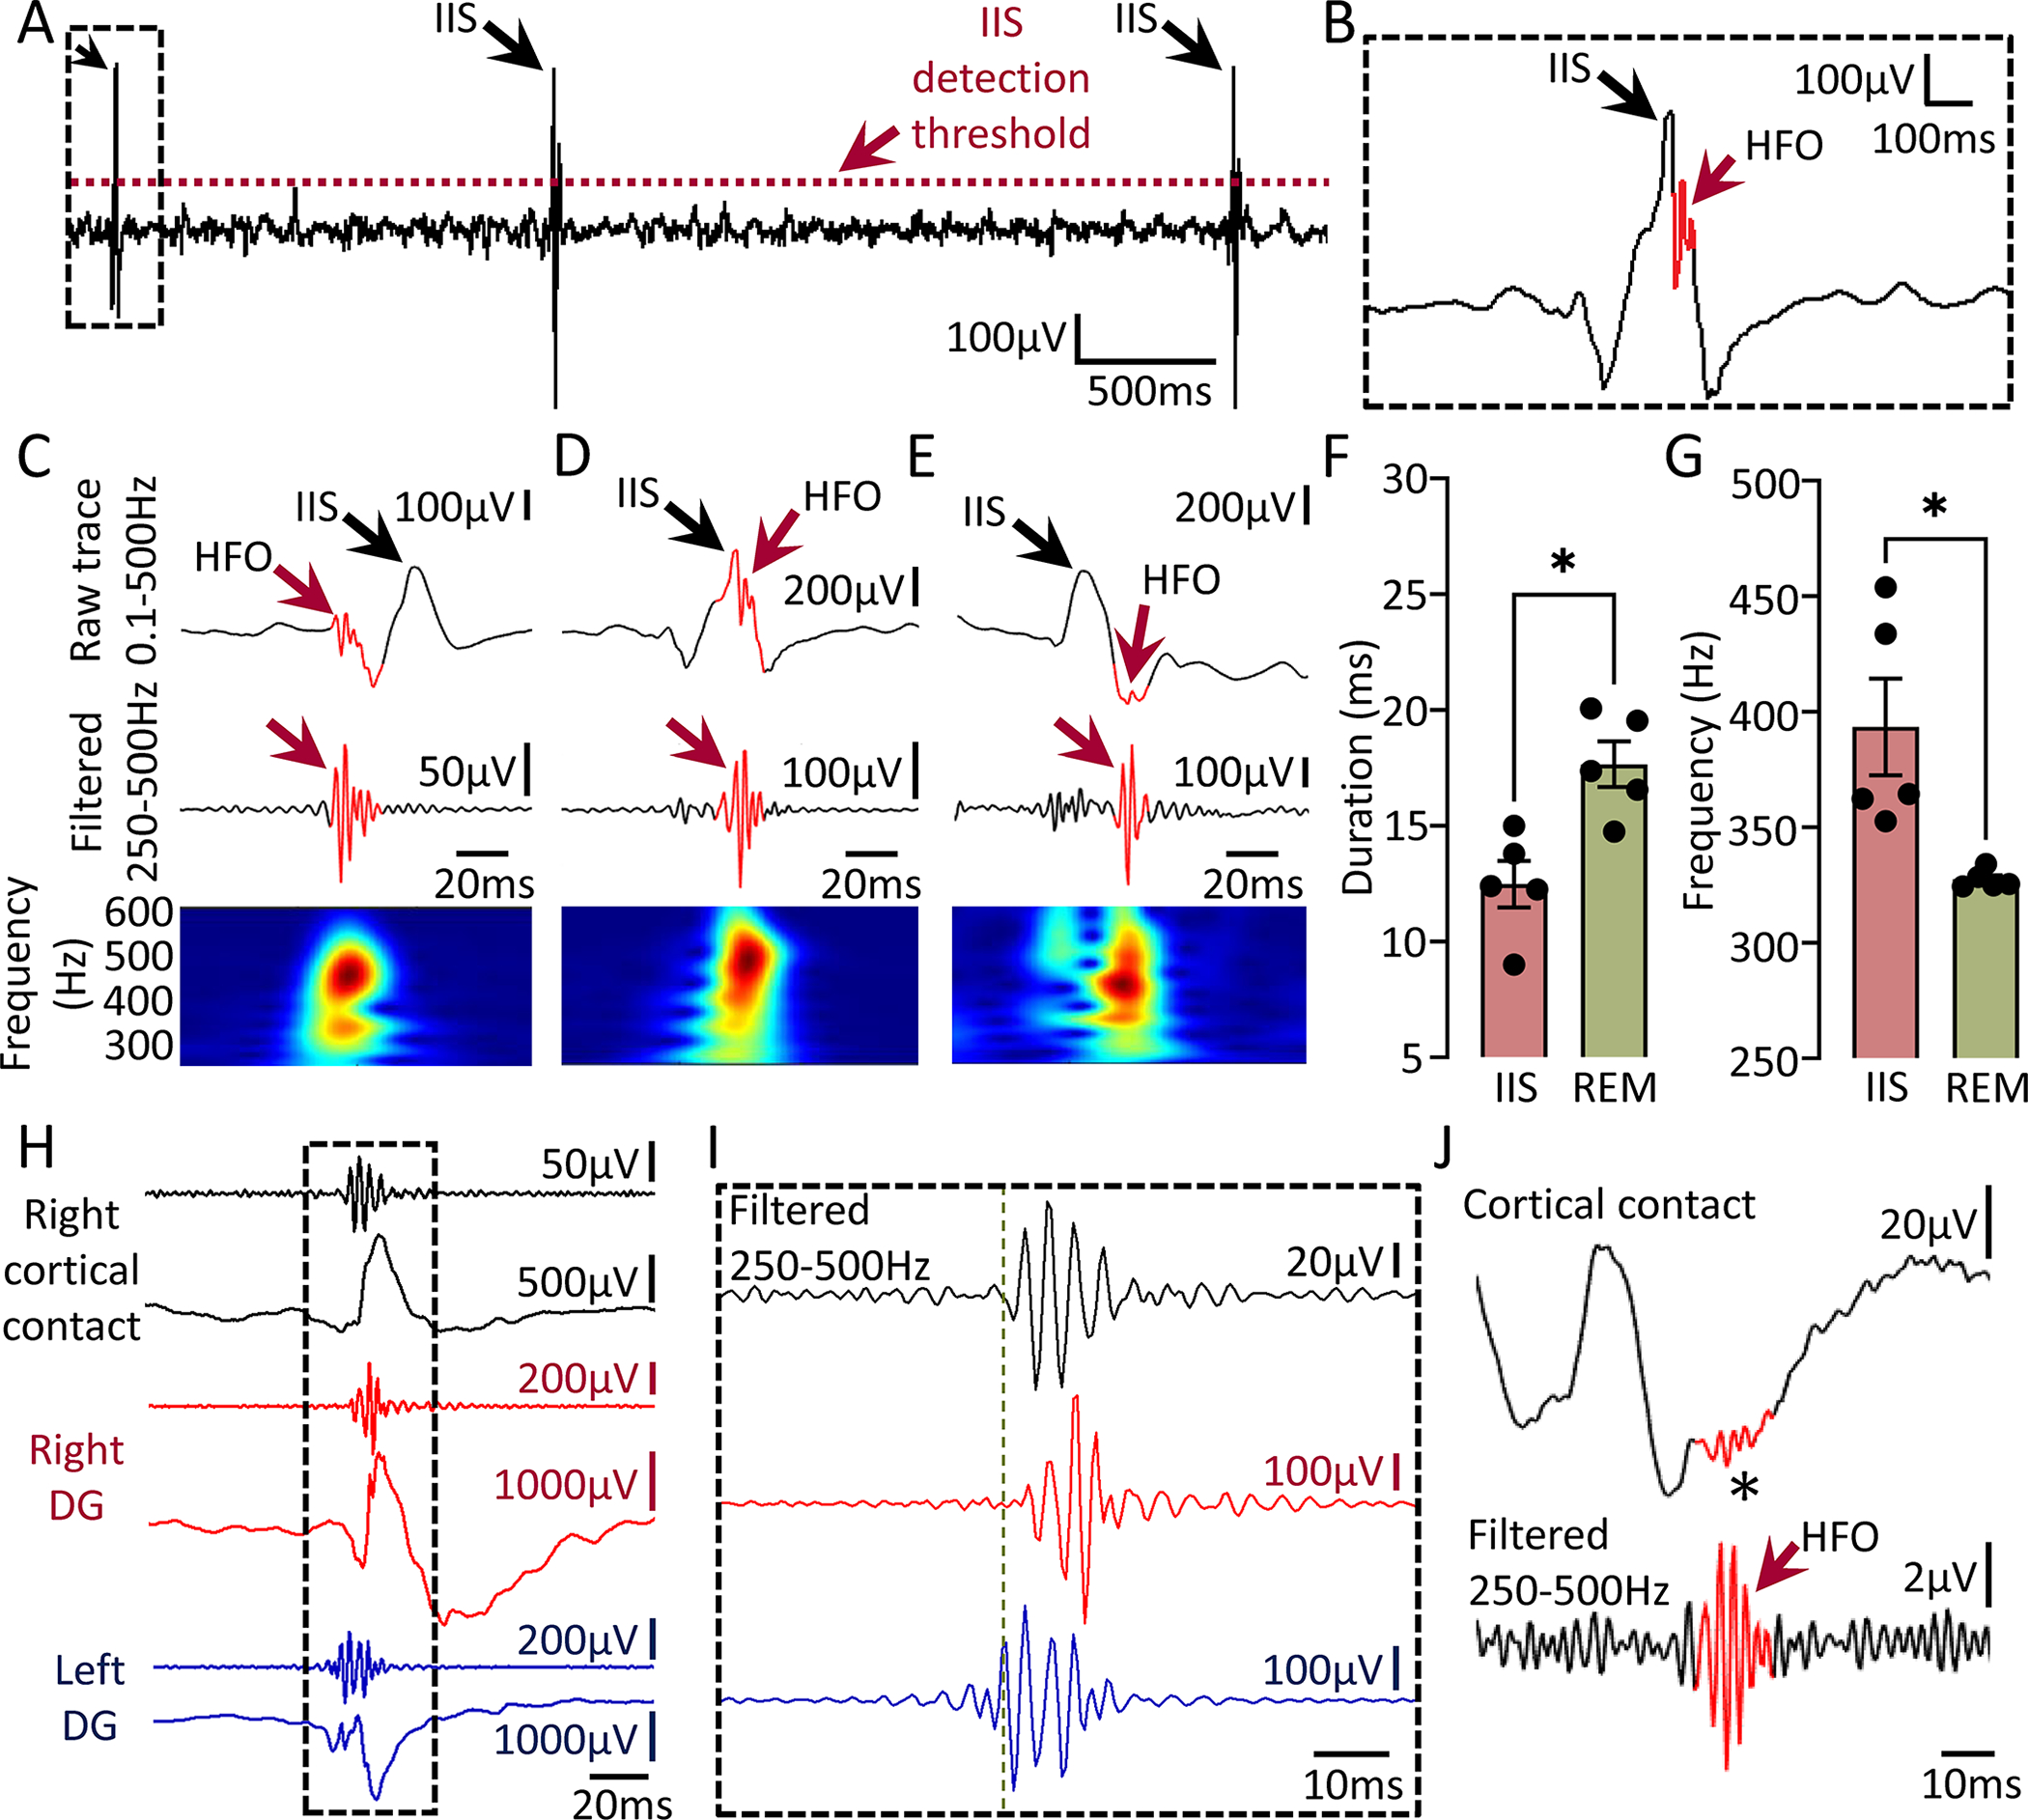
Figure 7: HFOs associated with IIS and detection of HFOs from the cortical surface.

(A) Detection of IIS during REM sleep in a Tg2576 transgenic mouse. Threshold used for IIS detection is denoted by a red dotted line.
(B) Expanded trace of a representative IIS from the inset in A. Note the presence of an HFO (red arrow).
(C) Example of an HFO occurring before the peak amplitude of an IIS.
(D) Example of an HFO occurring during an IIS.
(E) Example of an HFO occurring after an IIS peak.
(F) HFOs associated with IIS were significantly shorter in duration compared to HFOs occurring independent of IIS (paired Student’s t-test, t=3.33, df=4, p=0.02).
(G) Same as in F but for spectral frequency. HFOs associated with IIS showed significantly higher spectral frequency vs. HFOs independent of IIS (paired Student’s t-test, t=3.01, df=4, p=0.03).
(H) HFOs during an IIS recorded simultaneously from left (blue traces) and right DG (red traces) and overlying right frontal cortex (black traces) using a subdural screw electrode.
(I) Expanded traces from the inset in H showing filtered traces in the 250–500Hz frequency. Note that HFOs do not start or peak at the same time in all recording channels. Vertical green line denotes onset of the HFO in the left DG.
(J) Representative example of an HFO (red arrow) recorded with a subdural screw electrode from the right frontal cortex during SWS. Note presence of the HFO in the unfiltered trace (asterisk).
