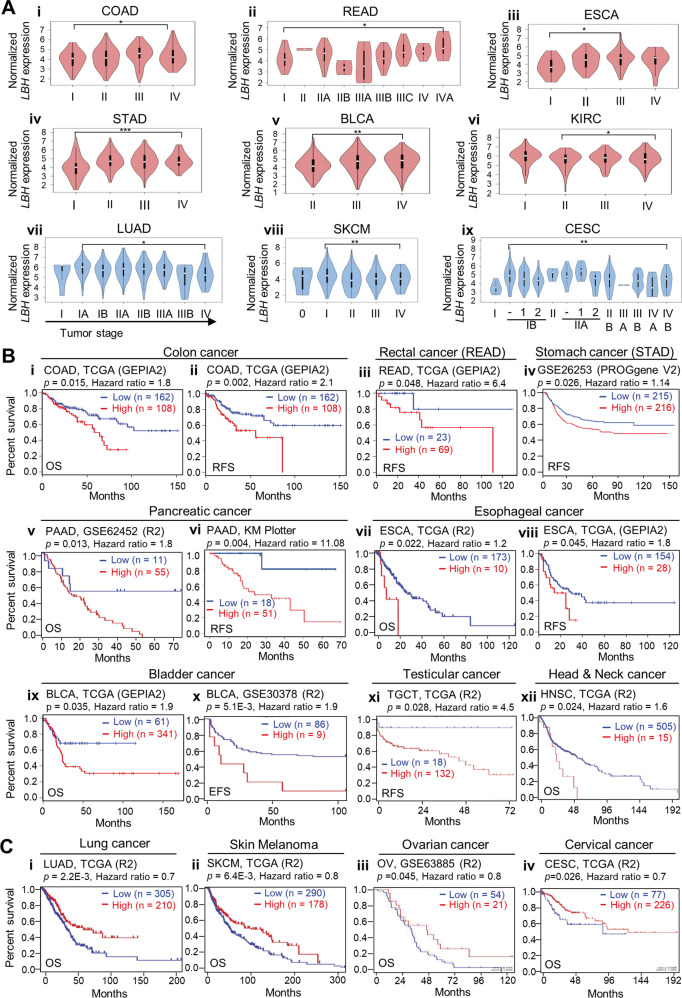
Fig. 3. Correlation of LBH expression with tumor stage and patient survival.
A Violin plots showing significant LBH expression changes across different tumor stages in multiple cancer types. (i–vi) Cancer types with increased LBH expression levels in the later tumor stages (III/IV) were: (i) COAD - colon adenocarcinoma, (ii) READ - rectum adenocarcinoma, (iii) ESCA - esophageal carcinoma, (iv) STAD - stomach adenocarcinoma, (v) BLCA - bladder urothelial carcinoma, and (vi) KIRC - kidney renal clear cell carcinoma. (vii–ix) Cancer types with decreased LBH expression in the later stages were: (vii) LUAD - lung adenocarcinoma, (viii) SKCM - skin cutaneous melanoma, and (ix) CESC Cervical squamous cell carcinoma. Violin plots were generated from GEPIA2. One-way ANOVA test: P-values as indicated. B–C Kaplan–Meier plots showing overall and relapse-free survival of patients with high (red) and low (blue) intra-tumoral LBH expressions in: B LBH-overexpressing, and C LBH-underexpressing cancer types. The TCGA-GEPIA, R2 platform (R2), and Kaplan–Meier (KM) plotter patient cohorts used, and the number (n) of cases with LBH high and low expression are indicated. Log-rank test: P-values (threshold p < 0.05) and Hazard Ratios (HR), as indicated. OS overall survival, RFS relapse-free survival, EFS event-free survival. See also Fig. S2.

