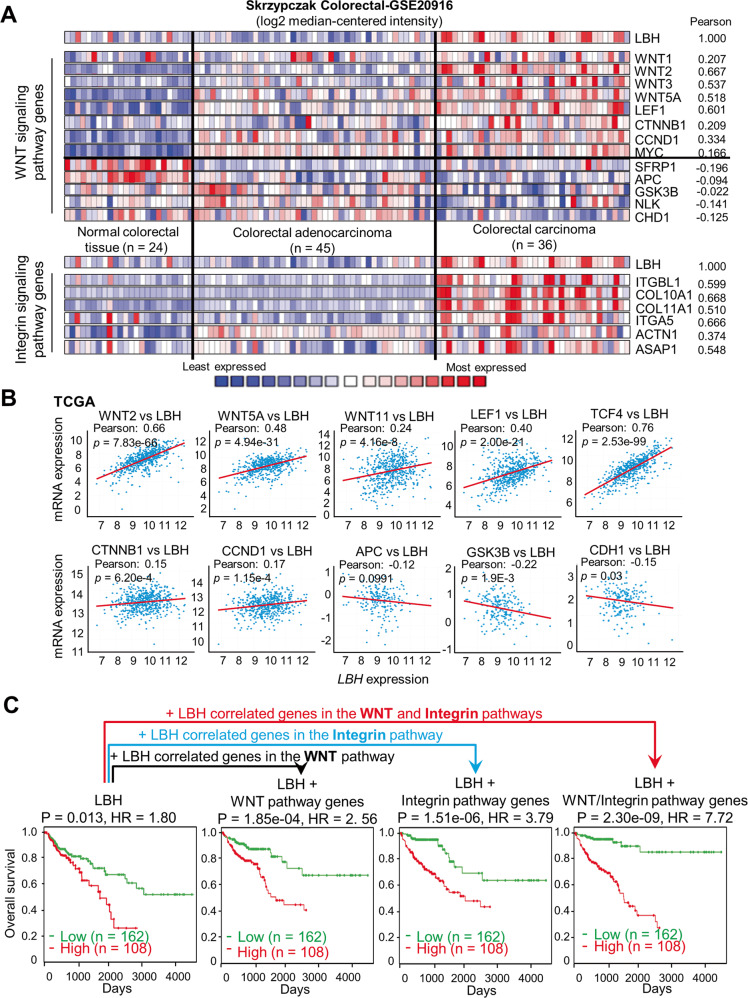
Fig. 6. LBH overexpression in colon cancer correlates with WNT-Integrin signaling genes, predicting poor outcome.
A, B Co-expression and correlation analysis of LBH with WNT/Integrin pathway genes. A Heatmaps of LBH and correlated genes in a representative colorectal cancer dataset from Oncomine (Skrzypczak_Colorectal-GSE20916). Blue signifies low, and red equals high mRNA expression. Pearson correlation coefficients between LBH and indicated genes are listed. B Dot plots showing correlations between LBH expression and expression of key WNT pathway genes in colon cancer based on TCGA data. Pearson correlation coefficients (R-values) and P-values, as indicated. See also Figs. S6, S7, S8. C Kaplan−Meier plot of overall survival in colon cancer patients (n = 270) stratified by the LBH/WNT/Integrin signatures. Multivariate Cox regression analysis of COAD patient data from TCGA. Log-rank test: P-values and Hazard Ratios (HR), as indicated. See also Table S6.

