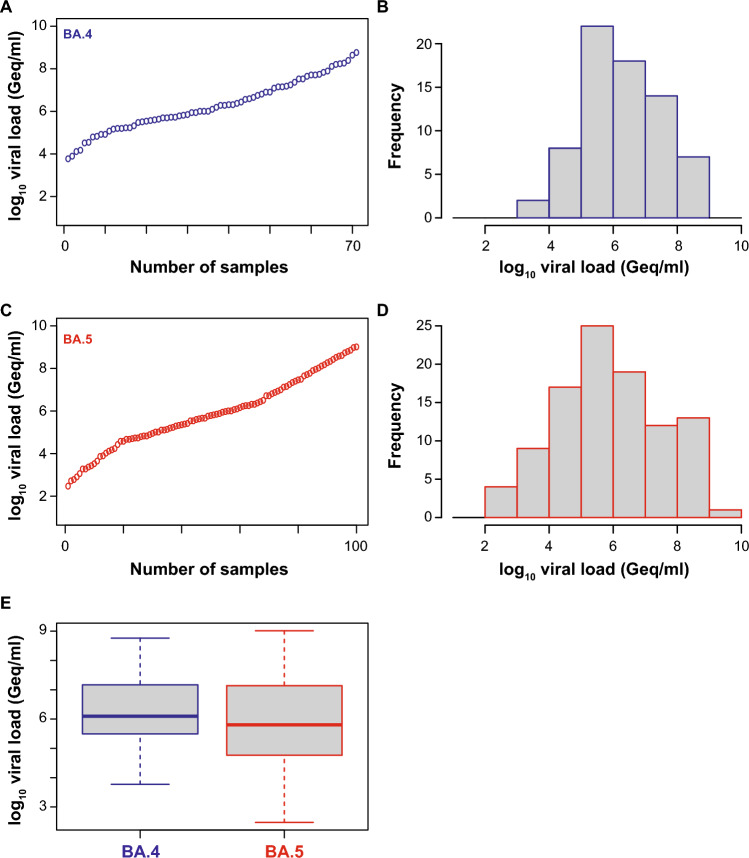
Fig. 1.
SARS-CoV-2 viral load distribution of respiratory samples included in this study. A, C Shown is the log10 viral load (Geq/ml) of 71 SARS-CoV-2-positive Omicron-BA.4 (A, blue) and 100 SARS-CoV-2-positive Omicron-BA.5 (C, red) patient samples, sorted by ascending magnitude of the viral load from left to right. Each dot indicates one patient and the sample’s ID is indicated. B, D Depicted is the histogram of the viral load distribution for Omicron-BA.4 (B, blue) and for Omicron-BA.5 (D, red) by categorization of samples into defined log10 viral load ranges. Each histogram bar indicates the number of samples in the respective viral load range. E Depicted is the comparison of the samples shown in A and C. The horizontal line in the box plots shows the median of the samples, bound between upper and lower quartiles, and whiskers between minimum and maximum are indicated

