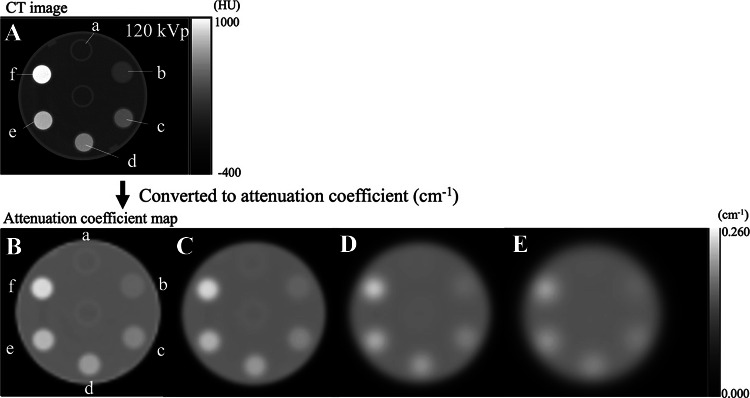
Fig. 2.
CT image of the phantom obtained at 120 kVp (A) and CT-based attenuation coefficient maps smoothed with no filter (B) and with Gaussian filter sizes of 10 (C), 20 (D), and 30 (E) mm. Rod (a) was filled with water, and rods (b–e) were filled with K2HPO4 solution of concentrations 120 (b), 275 (c), 450 (d), 666 (e), and 960 (f) mg/cm3 to simulate different bone densities

