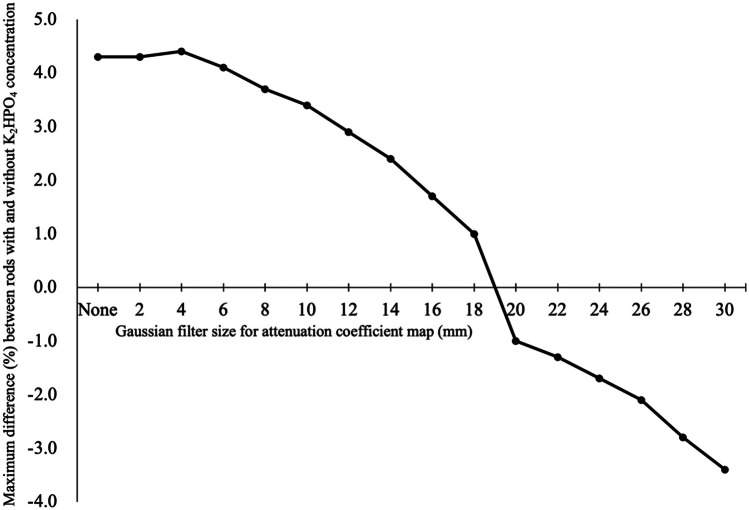
Fig. 6.
Maximum difference (%) between rods with and without K2HPO4 concentration as a function of Gaussian filter size in the CTAC maps. Maximum difference (%) between rods with and without K2HPO4 concentration as a function of Gaussian filter size in the CTAC maps. The maximum difference was observed in the rods with K2HPO4 concentrations of 960 mg/cm3 when the Gaussian filter size was 0–16 mm and 26–30 mm. The maximum differences when Gaussian filter sizes of 18 mm and 20–24 mm were observed in the rods with 666 mg/cm3 and 275 mg/cm3, respectively

