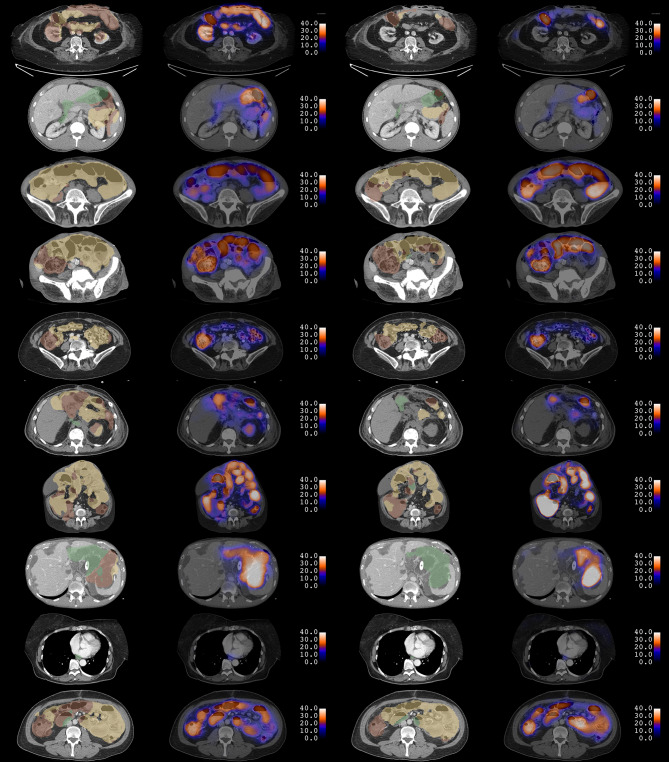
Fig. 4.
Examples of CNN predictions in 10 test subjects. Each row corresponds to the same single slice of a CT scan as in Fig. 3. 2d CNN predictions for bowel segmentation and diameter maps are shown in the first and second columns. 3d CNN predictions are shown in the third and fourth columns. In both segmentations, red, yellow, and green correspond to foregut, midgut, and hindgut, respectively. Diameters are expressed in units of millimeters. Some incorrect predictions of features are noted

