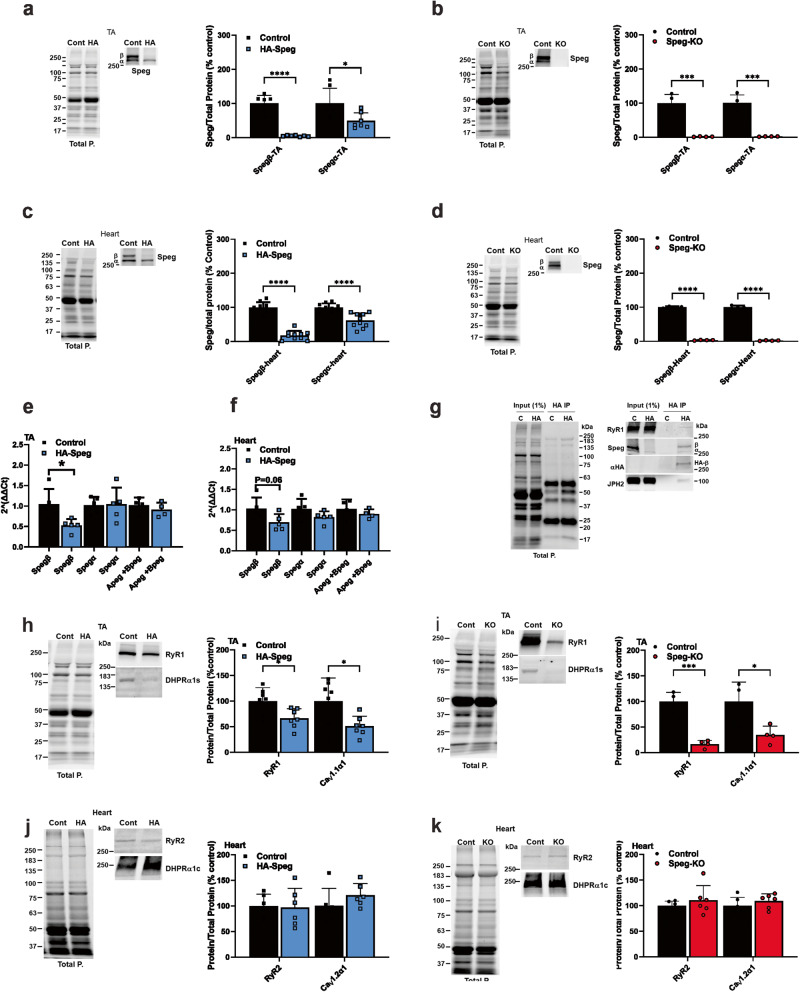
Fig. 1. Speg and ECC protein expression levels in the TA and cardiac muscle of male HA-Speg and Speg-KO mice.
a Spegβ and Spegα expression in the TA of HA-Speg mice (homozygous) compared to controls (WT) (n = 7). A representative western blot is shown on the left. Total protein (in all panels) was obtained using stain-free gels (Bio-Rad), and after transfer of the proteins to the PVDF membrane (Immobilon®-FL, Millipore), the PVDF membrane was imaged by using a ChemiDocTM MP imaging system (Bio-Rad). b Spegβ and Spegα expression in the TA of Speg-KO mice (homozygous) compared to controls (Spegfl/fl) (n = 4 each). A representative western blot is shown on the left. c Spegβ and Spegα expression in hearts of HA-Speg mice compared to control mice (n = 10 each). A representative western blot is shown on the left. d Spegβ and Spegα expression in the hearts of Speg-KO mice (homozygous) compared to controls (Spegfl/fl) (n = 4 each). A representative western blot is shown on the left. e Expression of mRNA for Spegα, β, Apeg-1 + Bpeg in TA muscles of control (n = 4–5) and HA-tagged Speg mice (n = 4–5), respectively. P values are indicated as analyzed by Welch’s t test. All statistical tests are two-sided. Data are represented as mean ± standard deviation. f Expression of mRNA for Spegβ, Spegα, Apeg-1, and Bpeg in hearts of control (n = 4–5) and HA-tagged Speg mice (n = 4–5), respectively. P values are indicated as analyzed by Welch’s t test. All statistical tests are two-sided. g Immunoprecipitation with HA antibody of homogenate from HA-Speg and control mice. The figure shows western blot of total proteins and western bot with Speg antibody and HA antibody. h ECC protein levels in the TA of Speg-KO mice compared to controls with a representative western blot (n = 7 each). i ECC protein levels in TA of Speg-KO mice compared to controls with a representative western blot (n = 4 each). j ECC protein levels in the hearts of Speg-KO mice compared to controls with a representative western blot (n = 6 each). k ECC protein levels in hearts of Speg-KO mice compared to controls with a representative western blot (n = 6 each). All mice used for the data in this figure were male. Data are shown as the mean ± SD. ****P < 0.0001, ***P < 0.001, **P < 0.01, *P < 0.05.

