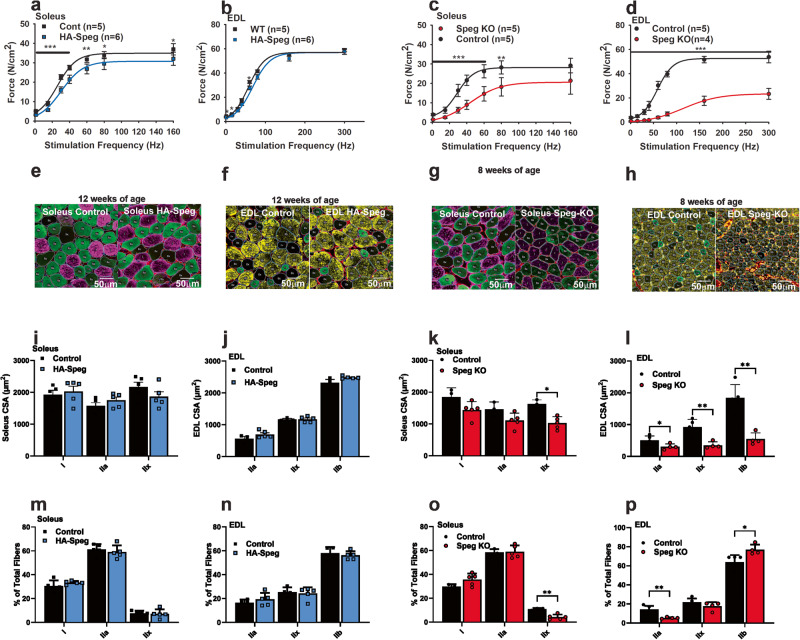
Fig. 2. Functional consequences of Speg deficiency.
Skeletal muscle function in HA-Speg (14 weeks), WT (13 weeks), Speg-KO (8–9 weeks), and Spegfl/fl (8–9 weeks) male mice were assessed using the indicated skeletal muscle functional or structural measurements. All data in this figure were obtained with male mice. Data on the diaphragm and separate data on female mice of each genotype are provided in the Supplementary Data Fig. 2. The Speg-KO mice used were younger than HA-Speg mice because they become extremely sick at ~10 weeks of age and often do not survive the echoes. a Force-frequency data for control (WT) and HA-Speg soleus. b Force-frequency data for the control (WT) and HA-Speg EDL. c Force-frequency data for control and Speg-KO soleus. d Force-frequency data for control and Speg-KO EDLs. e Fiber-type-specific staining of a representative cross-section from the soleus of control and HA-Speg mice. f Fiber-type-specific staining of a representative cross-section from the EDL of control and HA-Speg mice. g Fiber-type-specific staining of a representative cross-section from the soleus of control and Speg-KO mice. h Fiber-type-specific staining of a representative cross-section from the EDL of control and Speg-KO mice. i Average CSA of different fiber types in the soleus of control and HA-Speg mice. j Average CSA of different fiber types in the EDL of control and HA-Speg mice. k Average CSA of different fiber types in the soleus of control and Speg-KO mice. l Average CSA of different fiber types in the EDL of control and Speg-KO mice. m Fiber-type distribution in the soleus of control and HA-Speg mice. n Fiber-type distribution in the EDL of control and HA-Speg mice. o Fiber- type distribution in the soleus of control and Speg-KO mice. p Fiber-type distribution in the EDL of control and Speg-KO mice. Data are plotted as the mean ± SD. ****P < 0.0001, ***P < 0.001, **P < 0.01, and *P < 0.05.

