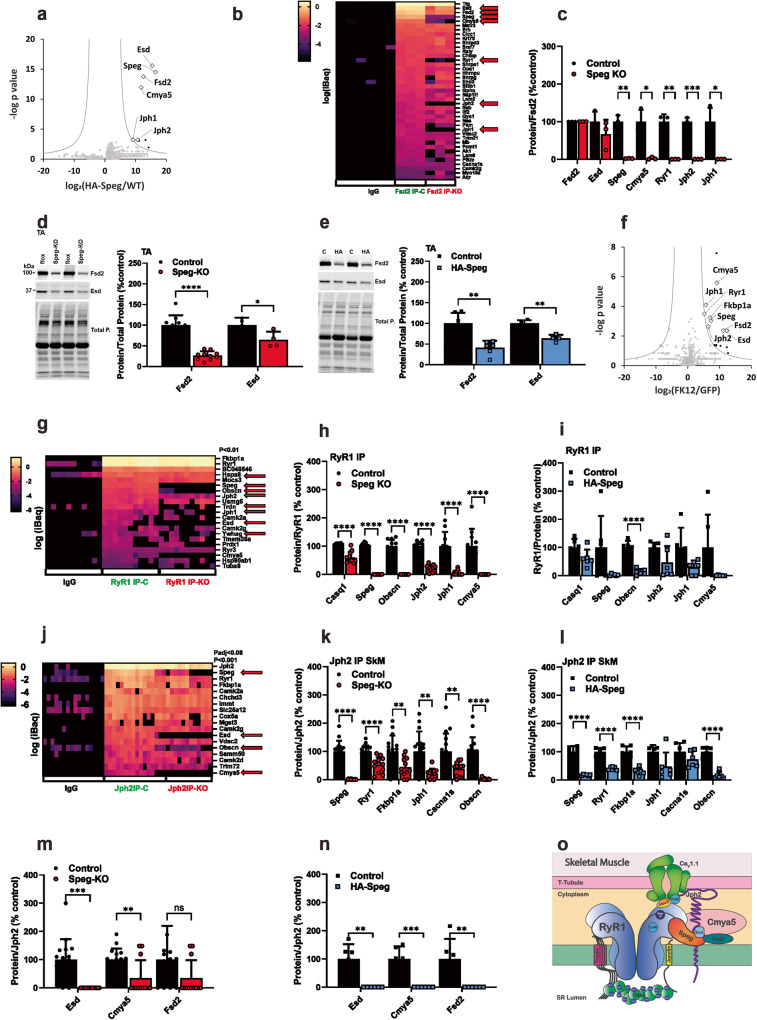
Fig. 5. Speg-binding proteins and effects of Speg deficiency in skeletal muscle.
a Proteins immunoprecipitated from the gastrocnemius muscle of HA-Speg mice using antibodies against the HA-tag and identified by mass spectrometry (n = 6 for both the HA-IP from WT mice (nonspecific, ns) and the IP from HA-Speg mice). b Heatmap of immunoprecipitation of Fsd2 from Control and Speg-KO mice. (n = 3 for each). Also shown are IgG controls for nonspecific binding. c Analysis of the effects of Speg deficiency on Fsd2 binding proteins. d Effects of Speg deficiency on the levels of Fsd2 (n = 10) and Esd (n = 4) in homogenates from TA muscle of Speg-KO mice. A representative western blot is shown on the left. e Effects of Speg deficiency on the levels of Fsd2 (n = 6) and Esd (n = 4) in homogenates from TA muscle of HA-Speg mice. A representative western blot is shown on the left. f Proteins biotinylated by FKBP12-BirA compared to GFP-BirA. Proteins were purified with streptavidin beads and identified by mass spectrometry (n = 5 for each). g Heatmap of specific proteins in the RyR1 IP from the gastrocnemius muscle of control and Speg-KO mice (n = 11 for each). Nonspecific is shown as IgG. h RyR1 binding proteins in gastrocnemius muscle that are reduced in the RyR1 IP from Speg-KO mice (n = 11 for each). i RyR1 binding proteins in gastrocnemius muscle that are reduced in the RyR1 IP from HA-Speg mice (n = 6 for each). j Heatmap of specific proteins in the Jph2 IP from the gastrocnemius muscle of control and Speg-KO mice (n = 14 for control, n = 12 for Speg-KO). Also shown are IgG controls. k ECC proteins reduced in the Jph2 IP from muscle of Speg-KO mice. l ECC proteins reduced in the Jph2 IP from the muscle of HA-Speg mice (n = 6–7). m Effect of Speg deficiency on the relative amounts of Esd, Cmya5 and Fsd2 in the Jph2 IP from Speg-KO mice. n Effect of Speg deficiency on the relative amounts of Esd, Cmya5 and Fsd2 in the Jph2 IP from HA-Speg mice. o Model summarizing the findings from the proteomic studies in skeletal muscle. Data are plotted as the mean ± SD. ****P < 0.0001, ***P < 0.001, **P < 0.01, and *P < 0.05.

