
FIGURE 4.
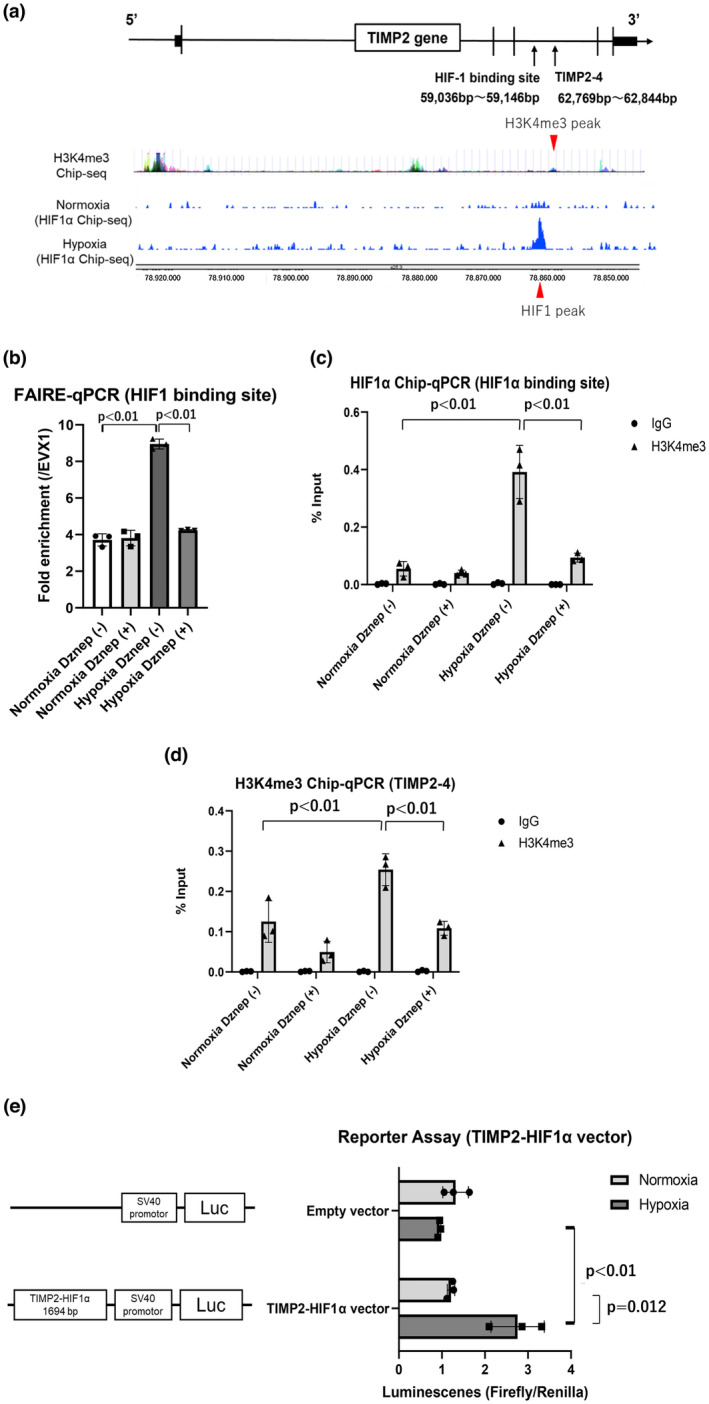
Results of FAIRE‐qPCR, ChIP‐qPCR of HIF1α, and ChIP‐qPCR of H3K4me3 in the HIF1α binding region in the TIMP2 gene in HK‐2 cells under normoxic condition and hypoxic condition for 24 h with or without Dznep treatment (a–d). The target regions of the TIMP2 gene were based on the HIF1α ChIP‐seq data (Kushida et al., 2016) and H3K4me3 ChIP‐seq data from ENCODE (a). These data were based on our group's CHIP‐seq of HIF1α in HK‐2 cells under normoxic and hypoxic conditions and H3K4me3 in seven cell lines under normoxic conditions from ENCODE. The result of FAIRE‐qPCR in the HIF1α binding region (red peak below) was evaluated via fold enrichment in the EVX1 region, which is the negative control region. First bar and plots indicate normoxia without Dznep (3.713 ± 0.336). Second bar and plots indicate normoxia with Dznep (3.811 ± 0.425). Third bar and plots indicate hypoxia without Dznep (8.950 ± 0.273). Fourth bar and plots indicate hypoxia with Dznep (4.235 ± 0.036) (b). The result of ChIP‐qPCR of HIF1α was assessed using %input. First bar and plots indicate normoxia using normal IgG without Dznep (0.00260 ± 0.00229). Second bar and plots indicate normoxia using anti‐H3K4me3 antibody without Dznep (0.0547 ± 0.0252). Third bar and plots indicate normoxia using normal IgG with Dznep (0.00134 ± 0.00232). Fourth bar and plots indicate normoxia using anti‐H3K4me3 antibody with Dznep (0.0404 ± 0.0100). Fifth bar and plots indicate hypoxia using normal IgG without Dznep (0.00353 ± 0.000345). Sixth bar and plots indicate hypoxia using anti‐H3K4me3 antibody without Dznep (0.3919 ± 0.0925). Seventh bar and plots indicate hypoxia using normal IgG with Dznep (0.0000459 ± 0.0000079). Eighth bar and plots indicate hypoxia using anti‐H3K4me3 antibody with Dznep (0.0936 ± 0.0155) (c). The result of ChIP‐qPCR of H3K4me3 in the region (red peak above) near the HIF1α binding site was investigated using %input. First bar and plots indicate normoxia using normal IgG without Dznep (0.00114 ± 0.00099). Second bar and plots indicate normoxia using anti‐H3K4me3 antibody without Dznep (0.125 ± 0.051). Third bar and plots indicate normoxia using normal IgG with Dznep (0.00152 ± 0.00132). Fourth bar and plots indicate normoxia using anti‐H3K4me3 antibody with Dznep (0.049 ± 0.026). Fifth bar and plots indicate hypoxia using normal IgG without Dznep (0.00082 ± 0.00142). Sixth bar and plots indicate hypoxia using anti‐H3K4me3 antibody without Dznep (0.254 ± 0.039). Seventh bar and plots indicate hypoxia using normal IgG with Dznep (0.00226 ± 0.00223). Eighth bar and plots indicate hypoxia using anti‐H3K4me3 antibody with Dznep (0.108 ± 0.017) (d). The results of reporter assay of the pGL3‐promotor vector with the HIF1α binding sequence in TIMP2 (TIMP2‐HIF1α vector). First bar and plots indicate normoxia with empty vector (1.318 ± 0.297). Second bar and plots indicate hypoxia with empty vector (0.940 ± 0.034). Third bar and plots indicate normoxia with TIMP2‐HIF1α vector (1.212 ± 0.086). Fourth bar and plots indicate hypoxia with TIMP2‐HIF1α vector (2.759 ± 0.617) (e). EVX1, even‐skipped homeobox 1; FAIRE, formaldehyde‐assisted isolation of regulatory elements; HIF, hypoxia‐inducible factor; HK‐2, human kidney 2; Luc, luciferase gene; TIMP2, tissue inhibitor of metalloproteinase 2; TSS, transcriptional start site. *p < 0.05, **p < 0.01. Three independent experiments (n = 3) were conducted.