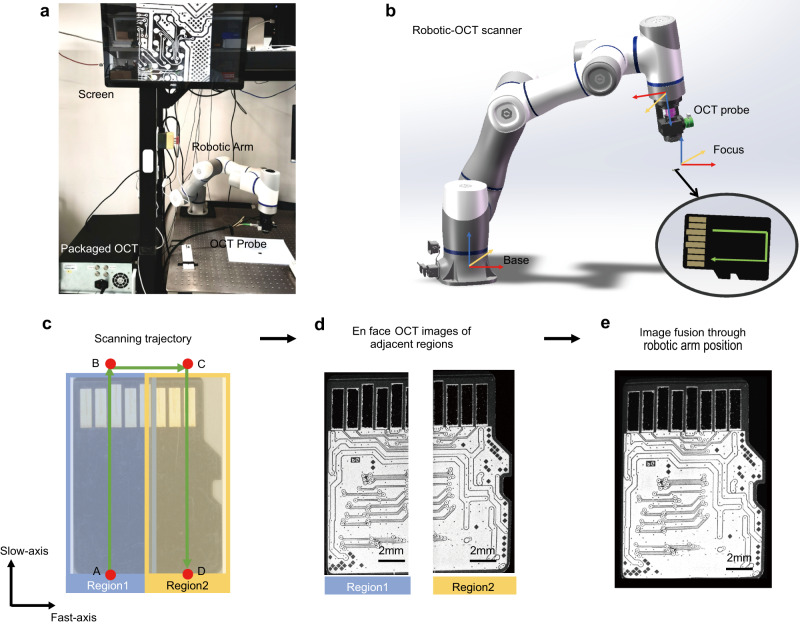
Fig. 1. Illustration of the continuous scanning robotic-OCT system.
a Photograph of the robotic-OCT system. b Schematic of the robotic-OCT scanner. The green arrow line indicates the scanning trajectory of the robotic arm. c Scanning trajectory of the robotic arm represented by the green arrow line, and the two adjacent continuous scanning regions, represented by blue (Region 1) and yellow (Region 2); the robotic arm moves along the slow axis from point A to point B in 15.5 s, moves from point B to point C in 6 s, reversed the scanning direction and moves along the slow axis from point C to point D in 15.5 s. d The en face OCT images of Region 1 and Region 2. e The fused image covering the entire area of a micro-SD card.

