Figure 7.
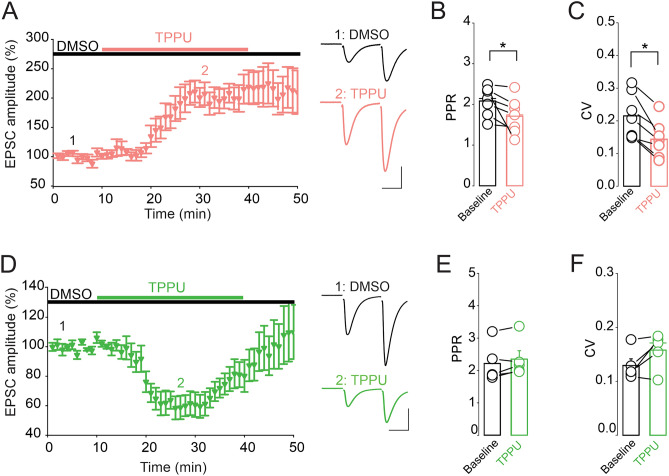
sEH inhibition bidirectionally gates glutamate synapses of CA1 pyramidal neurons. (A) Inhibition of sEH potentiates eEPSC amplitude in CA1 pyramidal neurons. Left graph is a summary of the time course and magnitude of the potentiation of EPSCs induced by TPPU (10 µM). Right panel depicts the average of at least thirty pairs of EPSCs collected at the time points indicated by the numbers in the left panel. Scale bars: 25 ms, 100 pA. (B) Averaged PPR of EPSCs obtained at baseline and during TPPU application. (C) Averaged CV of EPSCs obtained in absence and presence of TPPU. (D) Inhibition of sEH depresses eEPSC amplitude in CA1 pyramidal neurons. Left graph is a summary of the time course and magnitude of the depression of EPSCs induced by TPPU (10 µM). Right panel depicts the average of at least thirty pairs of EPSCs collected at the time points indicated by the numbers in the left panel. Scale bars: 25 ms, 100 pA. (E) Averaged PPR obtained in the absence and presence of TPPU. (F) Averaged CV of EPSCs obtained in absence and presence of TPPU.

