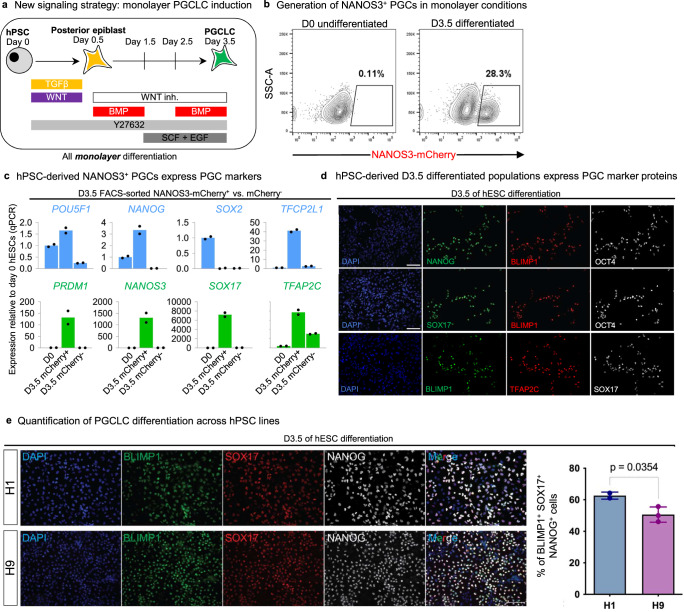
Fig. 4. A simplified monolayer platform to generate human PGCLCs.
a Schematic of the 2D monolayer PGCLC differentiation protocol reported in this manuscript. b Flow cytometry analysis of NANOS3-mCherry hESC shows fluorescent reporter expression before or after 3.5 days of differentiation. c qPCR analysis of NANOS3-mCherry+ PGCLCs and NANOS3-mCherry- non-PGCLCs derived after 3.5 days of differentiation, as shown in h; as a negative control, undifferentiated hPSCs (D0) were also analyzed, and gene expression is shown relative to undifferentiated hPSCs (which was set = 1.0). Data are presented as mean values. Source data are provided as a Source Data file. d Immunostaining of hPSCs differentiated for D3.5 showing expression of PGC markers in a subset of cells (nuclear counterstain: DAPI). Scale bar = 100 μm. e Validation of protein expression in D3.5 human ESCs. Each panel indicates the corresponding marker. The graph on the right represents the quantification of triple positive cells at D3.5 in the differentiation protocol. See Materials and Methods for details on quantification method. Each column represents mean with SEM for at least two biological replicates. n = 19,687 for H1, n = 57,067 for H9. DAPI was used as nuclear counterstain. Representative of two independent experiments. P values are shown above bars; error bars = standard error of mean. Statistical test–unpaired t test with Welch’s correction. Source data are provided as a Source Data file.

