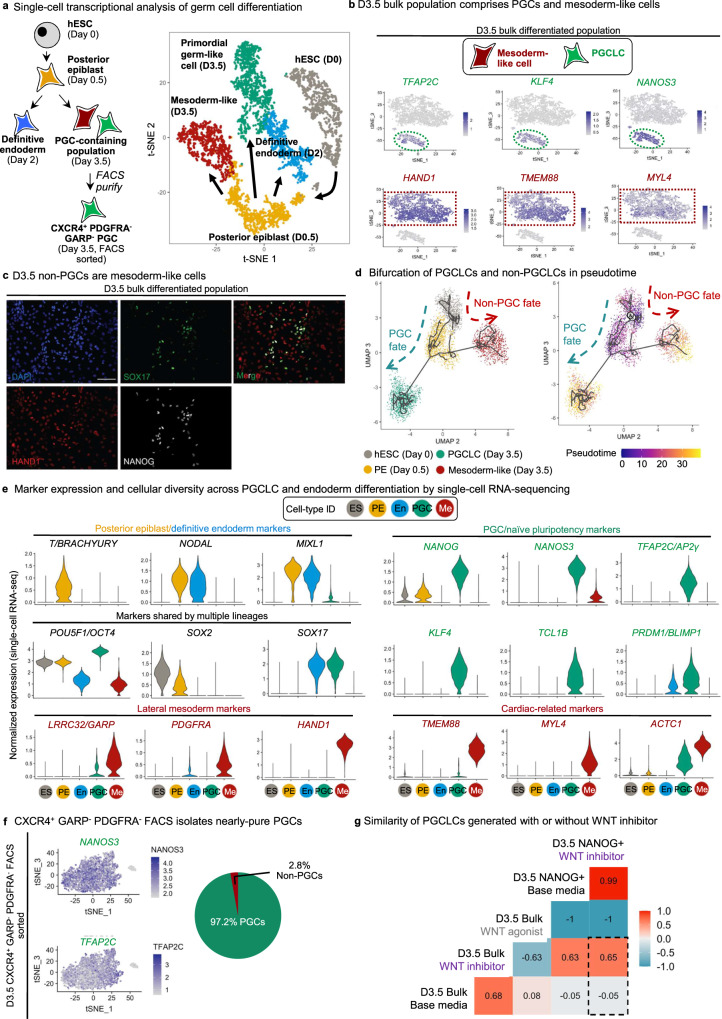
Fig. 7. Single-cell RNA-sequencing reveals stepwise changes in gene expression, transcriptional trajectories, and cellular diversity during hPSC differentiation to PGCLCs.
a Schematic of stages profiled for single-cell RNA-sequencing (scRNA-seq): D0 hPSCs, D0.5 posterior epiblast, D3.5 bulk population, D3.5 FACS-sorted CXCR4+/GARP−/PDGFRα− PGCLCs and D2 definitive endoderm (left); t-SNE projection of the combined scRNA-seq data sets, where single cells are colored by their cluster annotation (right). b t-SNE projection of hPSC-derived D3.5 bulk population shows that it is heterogeneous and segregates into 2 major clusters: a PGCLC cluster expressing PGC markers (TFAP2C, KLF4, NANOS3) and mesoderm-like cells (non-PGCLCs) expressing mesoderm markers (HAND1, TMEM88, MYL4). c Immunostaining of hPSC-derived D3.5 bulk population confirms that it is heterogeneous, comprising a mixture of PGCLCs (SOX17+, NANOG+) and non-PGCLCs (HAND1+) (nuclear counterstain: DAPI). Scale bar = 100 μm. Representative images from 4 independent experiments. d Pseudotemporal ordering of hESCs differentiating to PGCLCs or non-PGCLCs (mesoderm-like cells). e Violin plots of scRNA-seq data show expression of posterior epiblast, pluripotency, lateral mesoderm, cardiac, PGC, and naive pluripotency markers across the five different cell-types (clusters) identified from the combined scRNA-seq dataset (comprising merged D0, D0.5 posterior epiblast, D3.5 bulk, D3.5 FACS-sorted PGCLCs and definitive endoderm scRNA-seq datasets). f t-SNE projection of scRNA-seq data from hPSC-derived FACS-sorted D3.5 CXCR4+/GARP−/PDGFRα− PGCLCs shows that the predominant cluster express (comprising 97.2% of sorted cells) PGC markers (NANOS3 and TFAP2C). g Bulk RNA-seq of D3.5 FACS-sorted PGCLCs (generated with either XAV939 or base media) or D3.5 CHIR99021-treated populations (lacking PGCLCs). The Pearson correlation between these samples was calculated using median expression values of all expressed genes within all three biological replicates within each condition. Statistical test: Pearson correlation with 95% confidence interval.

