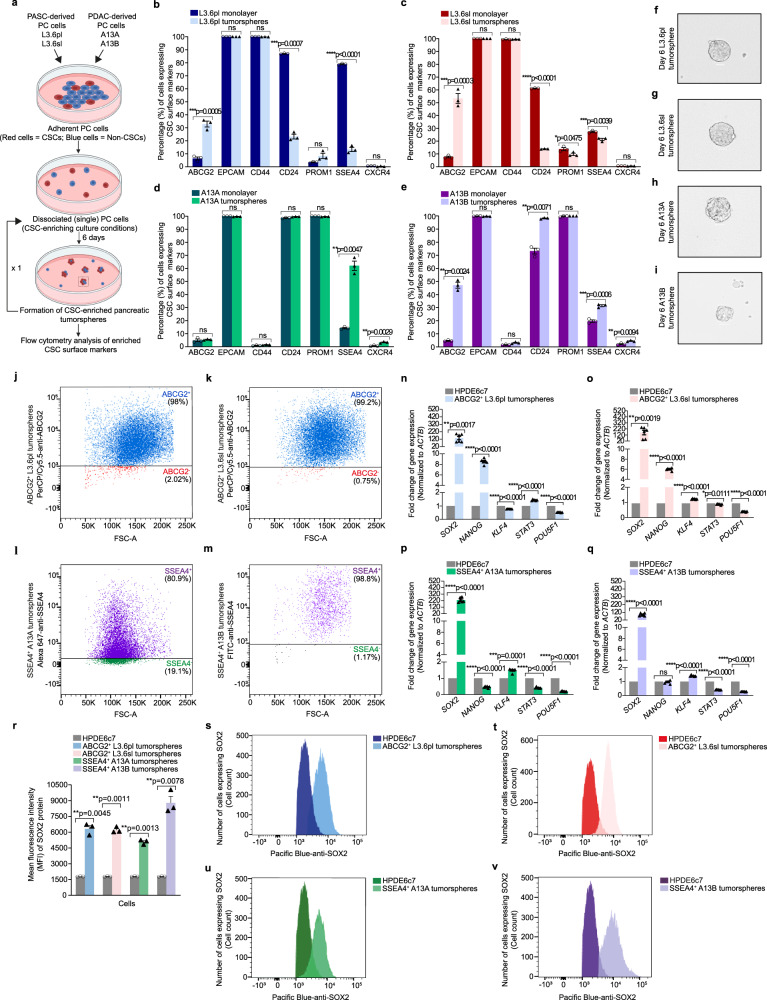
Fig. 1. Identification, selective enrichment, and characterization of PCSCs.
a Schematic diagram depicting the sphere-forming assay for analyzing enriched CSC surface markers in pancreatic tumorspheres by flow cytometry. The schematic diagram was created with Biorender scientific illustration software. b–e Flow cytometry analysis of enriched CSC surface markers in day 6 L3.6pl (b), L3.6sl (c), A13A (d), and A13B (e) tumorspheres versus their respective parental monolayer cultures. Data are presented as the mean value ± standard error of the mean (SEM; n = 3 biologically independent experiments). P values were calculated using a two-tailed t-test with Welch’s correction for unequal variances. f–i Brightfield images of day 6 L3.6pl (f), L3.6sl (g), A13A (h), and A13B (i) tumorspheres. Data are representative of 3 biologically independent experiments with similar results. Scale bar, 50 µm. j, k Flow cytometry analysis of ABCG2 enrichment in MACS-sorted ABCG2+ L3.6pl (j) and ABCG2+ L3.6sl (k) tumorspheres. l, m Flow cytomtery analysis of SSEA4 enrichment in MACS-sorted SSEA4+ A13A (l) and SSEA4+ A13B (m) tumorspheres. n–q qRT-PCR analysis of self-renewal and pluripotency genes in ABCG2+ L3.6pl (n), ABCG2+ L3.6sl (o), SSEA4+ A13A (p), and SSEA4+ A13B (q) tumorspheres versus HPDE6c7. ACTB was used for the normalization of mRNA expression levels. Data are representative of 3 biologically independent experiments (6 technical replicates per biological replicate) and presented as the mean value ± SEM. P values were calculated using a two-tailed t-test with Welch’s correction for unequal variances. r Mean fluorescence intensity of SOX2 protein expression in ABCG2+ L3.6pl, ABCG2+ L3.6sl, SSEA4+ A13A, and SSEA4+ A13B tumorspheres as compared to HPDE6c7. Data are presented as the mean value ± SEM (n = 3 biologically independent experiments). Statistical analysis was performed using a two-tailed t test with Welch’s correction for unequal variances. s–v Flow cytometry histograms of intracellular SOX2 protein expression in ABCG2+ L3.6pl (s), ABCG2+ L3.6sl (t), SSEA4+ A13A (u), and SSEA4+ A13B (v) tumorspheres versus HPDE6c7. Data are representative of 3 biologically independent experiments.

