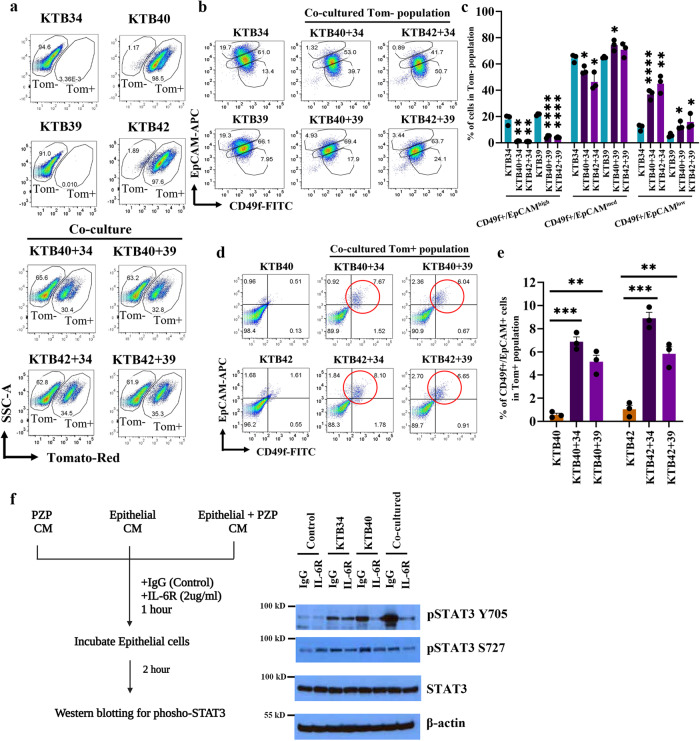
Fig. 8. The effects of PZP cells on trans-differentiation of epithelial cell lines.
a Gating of tomato- (Tom-) and tomato+ (Tom+) populations of KTB34, KTB39, and co-cultured KTB40/KTB42 and KTB34/KTB39 cell lines (n = 3). PZP cell lines are Tom+. b CD49f and EpCAM staining patterns of KTB34, KTB39, and co-cultured KTB40/KTB42 and KTB34/KTB39 cell lines (n = 3). Isotype controls are shown in Fig. S10b. c Quantification of CD49f+/EpCAMhigh, (KTB40 + 34*p = 0.002; KTB42 + 34*p = 0.0019; KTB40 + 39*p < 0.0001; KTB42 + 39*p < 0.0001), CD49f+/EpCAMmed (KTB40 + 34*p = 0.0186; KTB42 + 34*p = 0.0124; KTB40 + 39*p = 0.0183), and CD49f+/EpCAMlow (KTB40 + 34*p = 0.0006; KTB42 + 34*p = 0.0012; KTB40 + 39*p = 0.0185; KTB42 + 39*p = 0.0414) populations in Tom− cell population (n = 3). d CD49f and EpCAM staining patterns of KTB40, KTB42, and co-cultured KTB40/KTB42 and KTB34/KTB39 cell lines. Only Tom+ population was analyzed (n = 3). e Quantification of CD49f+/EpCAM+ population among Tom+ population (n = 3). (KTB40 + 34*p < 0.0001; KTB40 + 39*p = 0.0015; KTB42 + 34*p = 0.0002; KTB42 + 39*p = 0.0024) (f) pSTAT3 Y705, pSTAT3 S727, and STAT3 expression levels in KTB34 cells treated with CM obtained from KTB34, KTB40, and co-cultured KTB34 and KTB40 cells followed by IgG control and IL-6R neutralizing antibody treatment (n = 3). CM was treated with IgG or IL-6R neutralizing antibodies for 1 h and CM treatment lasted for 2 h. β–actin was used as an internal control (n = 3). In this representative experiment, the same batch of extracts was used to run four blots and each blot was probed with indicated antibodies separately. Statistical significance derived (*p < 0.05, **p < 0.01, ***p < 0.001, ****p < 0.0001) using Two-tailed t-test. All the data points are shown as mean ± SEM. Source data are provided as a Source Data file.

