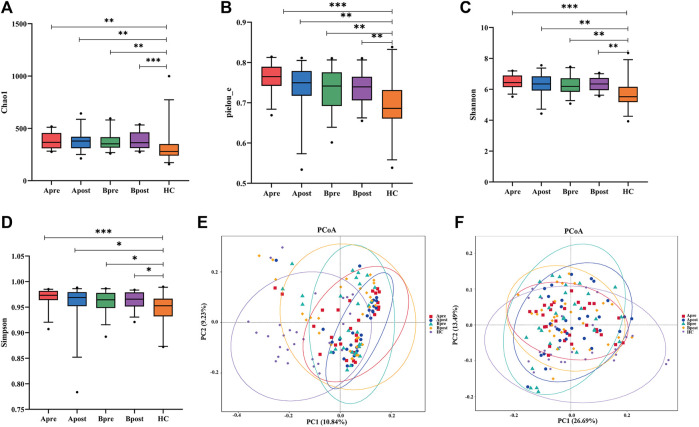
FIGURE 2.
Comparison of gut microbial diversity. (A–E) α-diversity of gut microbiota among the Apre group (n = 30), the Apost group (n = 30), the Bpre group (n = 30), the Bpost group (n = 30), and the HC group (n = 28) based on Chao1, Pielou_e, Simpson, Shannon, and dominant indices (Wilcoxon rank-sum test, *p < 0.05, **p < 0.01, ***p < 0.001). (F) Unweighted-Unifrac-based principal coordinate analysis (PCoA in Adonis) between healthy controls, acupuncture group, or sham-acupuncture group pre- and post-treatment (HC vs. Apre or Bpre, p = 0.001, Apre vs. Apost, p = 0.017, Apost vs. Bpost, p = 0.01). Apre, before acupuncture treatment; Apost, after acupuncture treatment; Bpre, before sham acupuncture treatment; Bpost, after sham acupuncture treatment; HC, healthy controls.

