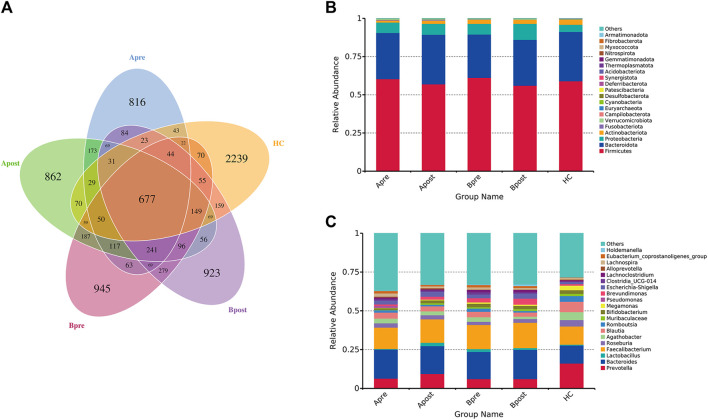
FIGURE 3.
The change in the number of ASV and the abundance of intestinal flora. (A) Petal diagram of ASV number of intestinal flora in five groups (B) Stacked histogram of relative abundance of taxa at the phylum level (C) Stacked histogram of relative abundance of taxa at the genus level. Apre, before acupuncture treatment; Apost, after acupuncture treatment; Bpre, before sham acupuncture treatment; Bpost, after sham acupuncture treatment; HC, healthy controls.

