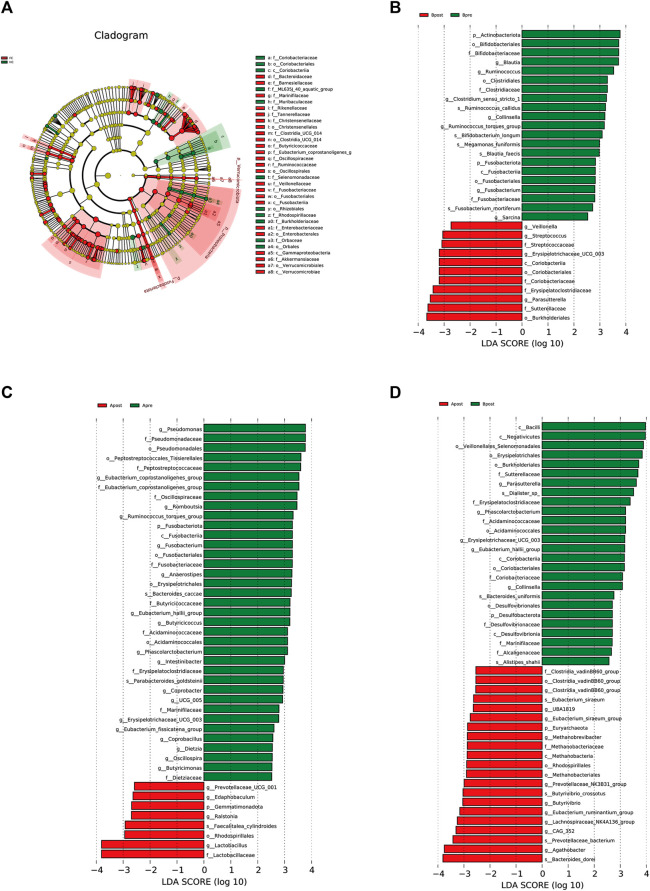
FIGURE 5.
LEfSe analysis of 16S rRNA-based microbiota abundance (A) Evolutionary branch diagram of the differential intestinal flora of FC patients and healthy subjects (LDA >2.5, p < 0.05). (B) The taxonomy bar chart of the differential intestinal flora before and after sham-acupuncture (n = 30) (LDA >2.5, p < 0.05). (C) The taxonomy bar chart of the differential intestinal flora before and after acupuncture (n = 30) (LDA >2.5, p < 0.05). (D) The taxonomy bar chart of the differential intestinal flora after acupuncture and sham-acupuncture (n = 30) (LDA >2.5, p < 0.05). Apre, before acupuncture treatment; Apost, after acupuncture treatment; Bpre, before sham acupuncture treatment; Bpost, after sham acupuncture treatment; HC, healthy controls.

