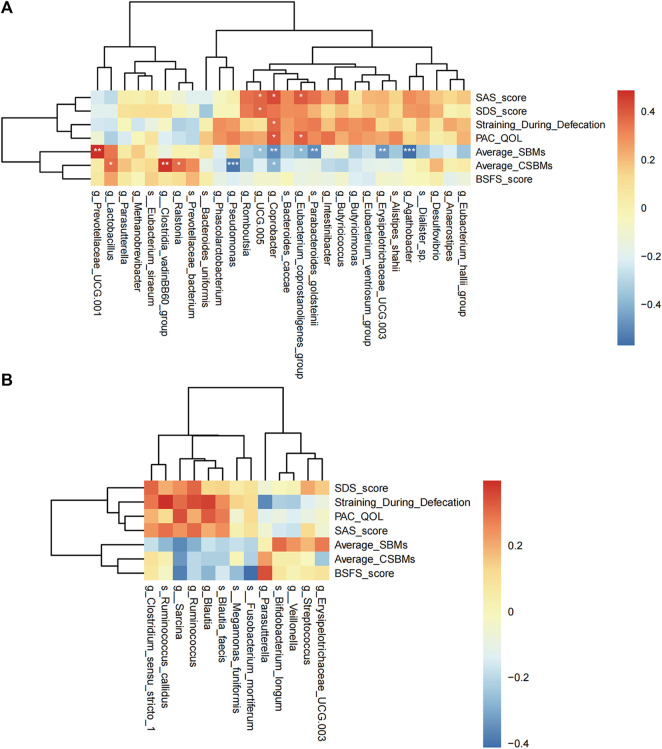
FIGURE 6.
Spearman correlation analysis. The correlation heat map of the acupuncture (A) or sham-acupuncture (B) specific-microbes and clinical indicators. The color depth represents the strength of correlation, red represents positive correlation, and blue represents negative correlation. p-value corrected by Benjamin Hochberg, *q < 0.05, **q < 0.01, ***q < 0.001.

