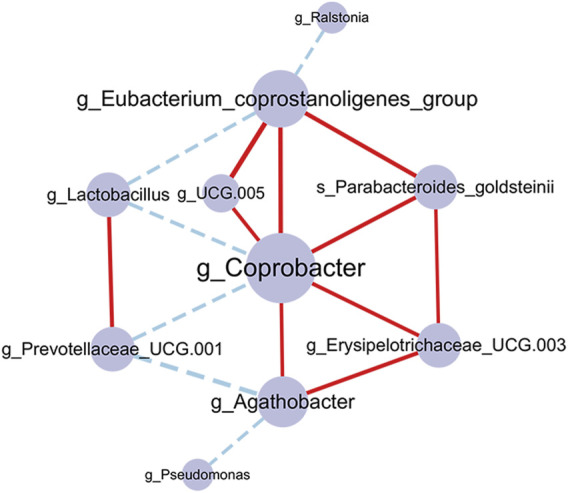
FIGURE 7.

Co-occurrence network of the gut microbiome in the acupuncture group. The larger the node and label, indicating the greater the centrality. The edges represent correlations between microbes, the red connection is a positive correlation, and the blue connection is a negative correlation. The thickness of the edge indicates the strength of the correlation. p-value corrected by Benjamin Hochberg.
